Fig. 4.
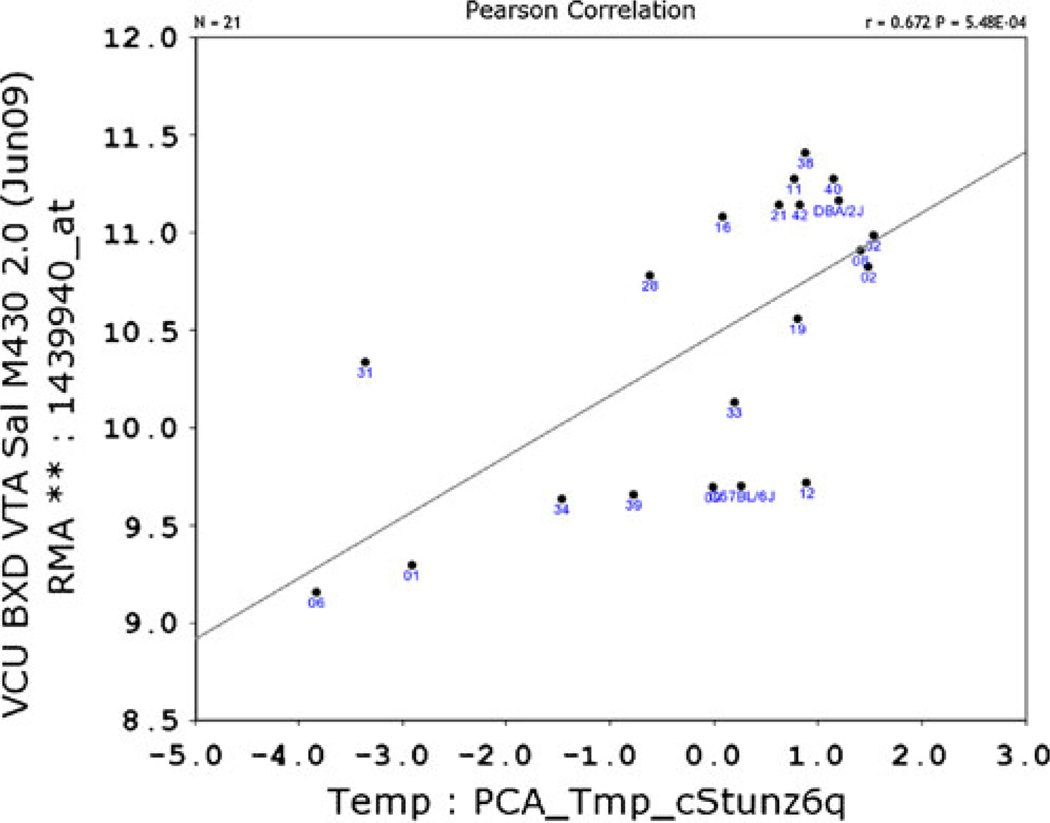
Bioinformatic resources depict correlation between VMB iron levels and Glt1 expression. VMB iron first principal component correlated with expression of Glt1. Correlation with principal component is positive but reflects an inverse relationship between Glt1 expression and VMB iron values. Graph generated using GeneNetwork.org; expression data are from the VTA dataset post-saline injection, with permission from Miles and colleagues

