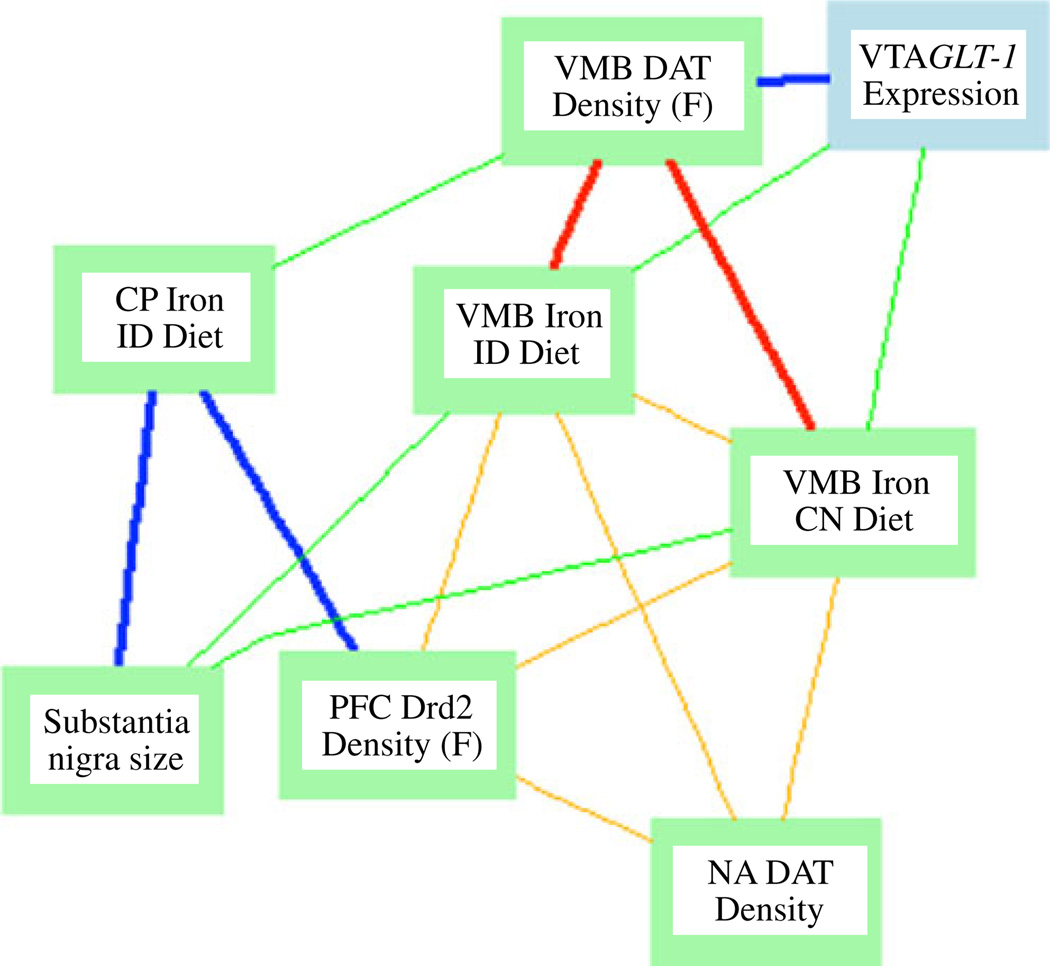
Fig. 6.
Network graph depicting correlations between VMB and CP iron, Glt1 expression, and dopamine-related phenotypes. Nodes represent phenotypes measured in the BXD strains; lines represent correlations. Bold lines −0.7<r<0.7. All other lines: −0.5<r<0.5. Blue and green indicate positive correlations; red and orange indicate negative correlation

