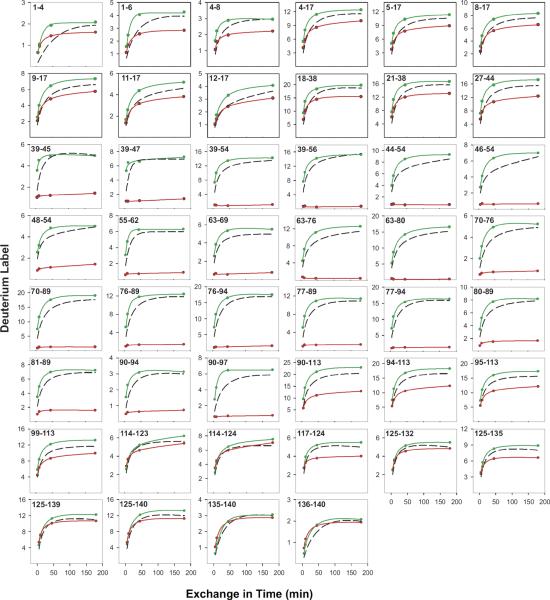
Figure 6.
H-D exchange/MS results for α-synuclein obtained as in Figure 4. Results for the soluble α-synuclein monomer (green) compare well with expected unprotected rates (dashed black curves). Results for the insoluble amyloid, shown in red, identify the well-protected chain segment that participates in the amyloid cross-β region and show the degree of protection in other regions.

