Figure 4.
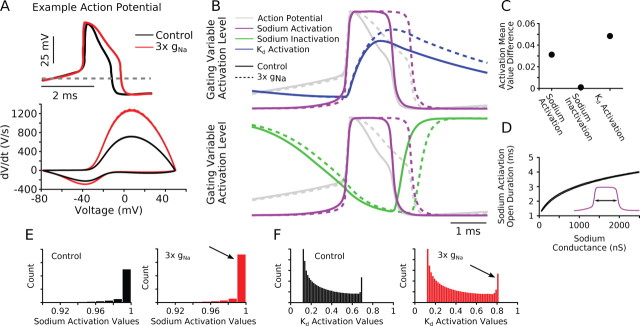
Sodium conductance changes lead to a proportionally greater activation of Kd conductance which lowers the firing rate overall. A, Top, An example action potential from a single model being injected with 10 nA/nF of current from the population (model 1 from Fig. 2) was overlaid from both control and 3× gNa conditions. Enhanced sodium conductance widens the action potential. Bottom, A phase plot of the same action potential shows that the voltage initially rises faster and then repolarizes more slowly followed by a final phase of more rapid repolarization when compared with control. B, Gating variables during the action potential shown in A. The normalized action potential is plotted in gray for comparison. Solid lines represent control; dotted lines represent 3× gNa. Top, High sodium activation is prolonged (purple dotted line). This leads to enhanced activation of the Kd conductance (blue dotted line). Bottom, No major changes to the amplitude of the sodium inactivation are observed (green). C, The difference of gating variable values (3× gNa minus control) shows that while the wider spikes lead to greater mean gNa activation, the Kd activation variable is enhanced proportionally more. There is no change in the mean level of activation for the sodium inactivation. Values are adjusted for firing rate. D, The time spent by the sodium activation in the open state is prolonged continuously when the sodium maximal conductance is increased up to 10-fold (2500 nS). Two (nearly identical) lines are plotted corresponding to the two models shown in Figure 2. Inset, Schematic of the quantity being measured, the time when the sodium activation variable value is >0.96 during an action potential. E, Histogram of sodium channel activation variable values over a train of action potentials (black, control; red, 3× gNa). Arrow highlights that with 3× gNa the gate is more likely to be open (a taller bar indicates more time spent in the open state). Axis is zoomed in to highlight high values of activation. F, Histogram of Kd activation variable values during a train of action potentials (black, control; red, 3× gNa). Arrow highlights that with 3× gNa, the Kd activation has consistently higher values indicating increased open probability.

