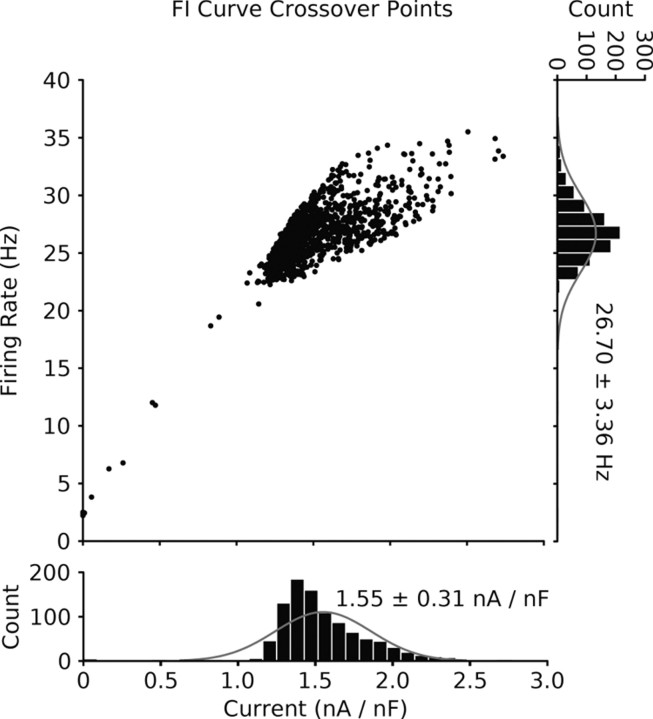
Figure 5.
FI curve crossover point occurs at diverse values of both frequency and current. The crossover points for all the reduced models are plotted in input current vs frequency space (n = ∼1000, few models had no intersection or extreme values for their crossover points and are omitted for clarity). The crossover point represents the value of current and frequency that separates the two effects enhanced sodium conductance has on the control FI curve. The scatter plot highlights that the crossover points from each model occur at many different values of frequency and current. Histograms of the current values (bottom, 1.55 ± 0.31 nA/nF) and frequency values (right, 26.7 ± 3.36 Hz) are plotted along with representative normal distributions (gray lines) that have equivalent means and variances.

