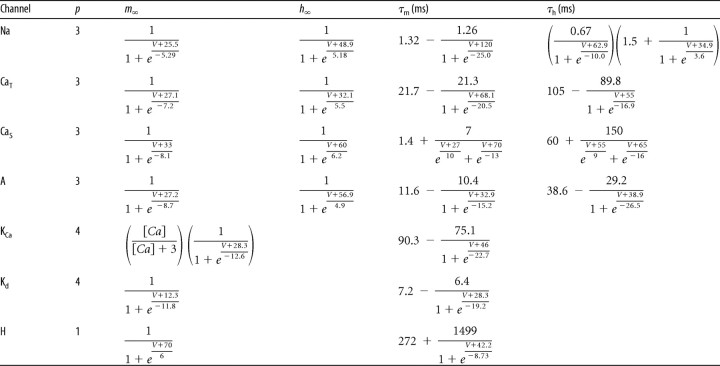
Table 1.
Functions used to describe channel activation and inactivation kinetics
Steady-state activation, m∞, and inactivation, h∞, for each of the channels in the model are shown, along with the time constants to approach this steady state, τm and τh. Ca is internal Ca2+ concentration in μM. V represents membrane potential in mV.

