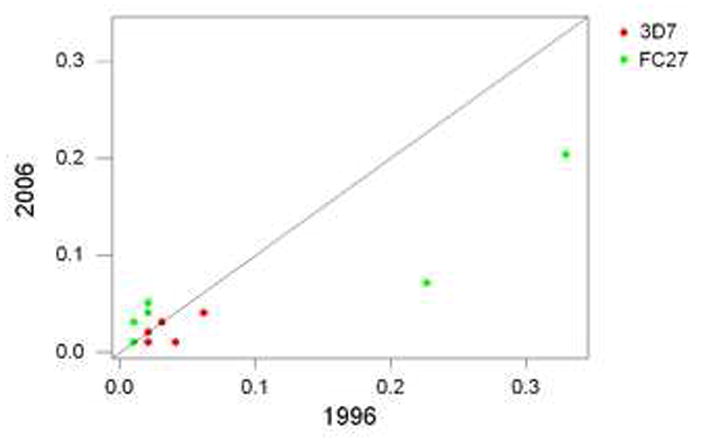
Figure 2.

Plot of V-region allele frequencies in 2006 vs. 1996, for alleles in the two allelic families (3D7 and FC27) that were present in both years. In the case of the 3D7 family, there was not a significant correlation between frequencies in the two years (rS = 0.661: n.s.). In the case of the FC27 family, there was a highly significant correlation between frequencies in the two years (rS = 0.963; P < 0.001).
