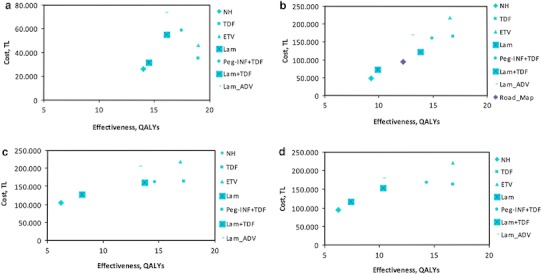
Fig. 1.

Results of cost-effectiveness analysis stratified by hepatitis B e antigen (HBeAg) and stage of liver disease: a HBeAg-positive (non-cirrhosis) b HBeAg-negative (non-cirrhosis) c HBeAg-positive (cirrhosis) d HBeAg-negative (cirrhosis). Results plotted on a cost-effectiveness plane. The x-axis represents the gain in QALYs with each strategy, and the y-axis the total healthcare costs (year 2010 values). NH natural history, Lam lamivudine, Lam + ADV adefovir salvage therapy, Peg_IFN + TDF pegylated interferon followed by tenofovir, ETV entecavir, TDF tenofovir
