
FIGURE 2.
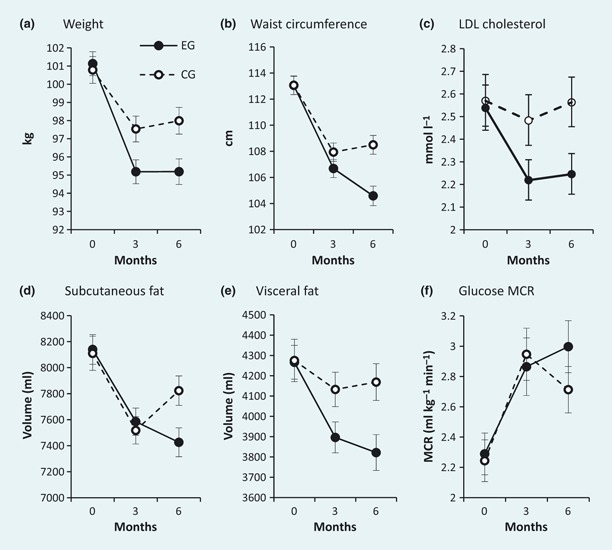
Anthropometric variables, LDL cholesterol, insulin sensitivity, resting energy expenditure and Beck score during the study. Experimental group: closed circles/solid line; control group: open circles/dashed line. Error bars represent 95% CIs. P-values for interaction between group and time assessed by repeated measures ANOVA are P < 0.001 for weight (a), P < 0.001 for waist circumference (b), P = 0.05 for LDL cholesterol (c), P = 0.02 for subcutaneous fat (d)*, p = 0.007 for visceral fat (e)*, P = 0.04 for metabolic clearance rate of glucose (MCR) (f)†. *Magnetic resonance imaging data were not complete in 15 out of the 74 participants: 8/37 in the experimental group (six because of dropout, two as a result of claustrophobia during the first examination) and 7/37 in the control group (six because of dropout, one as a result of claustrophobia during the first examination). †Data from the hyperinsulinaemic isoglycaemic clamp were not complete in 19 out of the 74 participants: 9/37 in the experimental group (six because of dropout, three as a result of patients’ fragile veins) and 10/37 in the control group (six because of dropout, four as a result of patients’ fragile veins).