
FIGURE 3.
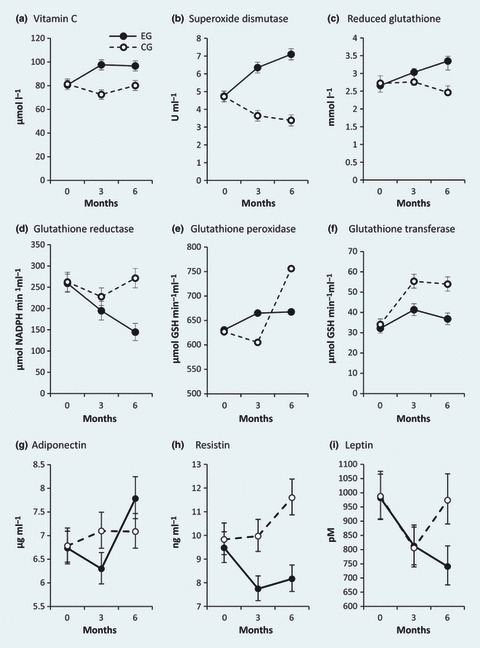
Plasma levels of oxidative stress markers and adipokines during the study. Experimental group: closed circles/solid line; control group: open circles/dashed line. Error bars represent 95% CIs. P-values for interaction between group and time assessed by repeated measures ANOVA are P = 0.002 for Vitamin C (a), P < 0.001 for superoxide dismutase (b), P < 0.001 for reduced glutathione (c), P < 0.001 for glutathione reductase (d), P = 0.004 for glutathione peroxidase (e), P = 0.003 for glutathione transferase (f), P = 0.02 for adiponectin (g), P = 0.005 for resistin (h) and P = 0.05 for leptin (i). GSH, glutathione; NADPH, nicotinamide adenine dinucleotide phosphate.