Figure 3.
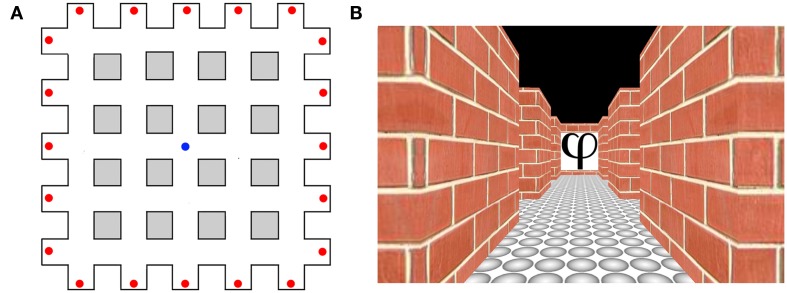
Heading direction selectivity in humans adapted from Baumann and Mattingley (2010). (A) Aerial schematic of the virtual environment used in the study by Baumann and Mattingley (2010). Red dots represent the locations of the abstract symbols that acted as orientation landmarks. The blue dot represents the starting location of each learning trial. (B) An example of a single image viewed by participants during the test phase.

