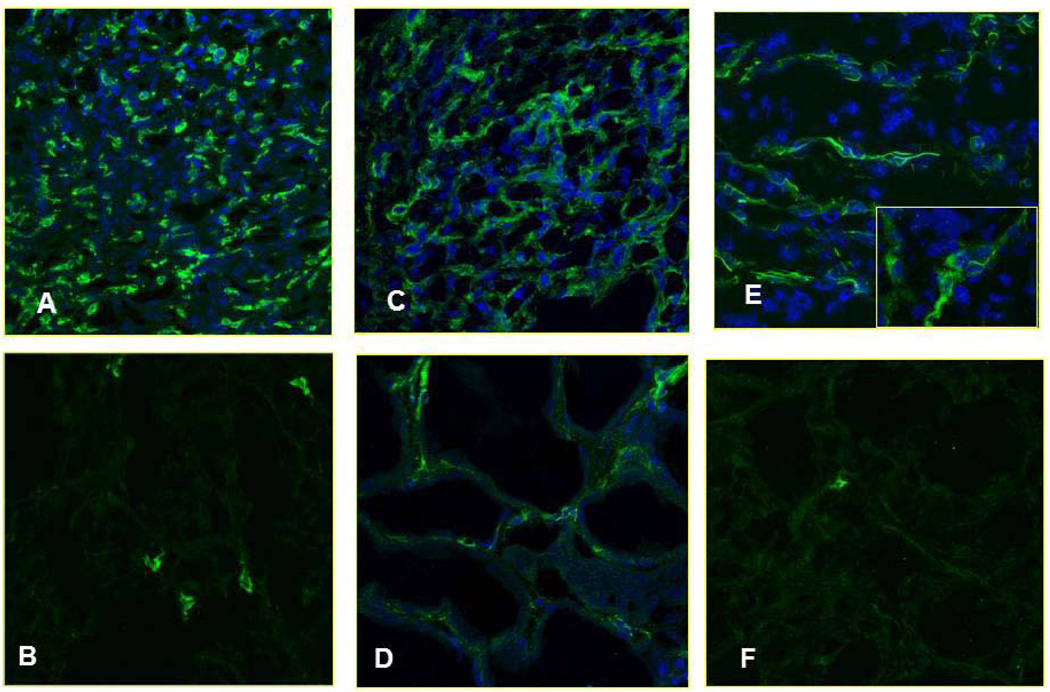
Figure 2. Analysis of tumor-infiltrating mDC and pDC in RCC kidney using confocal laser scanning microscopy.
Immunofluorescent indirect staining of mDCs was performed by using an anti-BDCA1 Ab in RCC and healthy control respectively (A and B), or anti-BDCA3 Ab in RCC and healthy control respectively (E and F) and staining of pDC by using an anti-BDCA4 Ab in RCC and healthy control respectively (C and D). Nuclei are highlighted with TO-PRO in blue, (magnification 40× for A, B, C and F, 63× for D and E).

