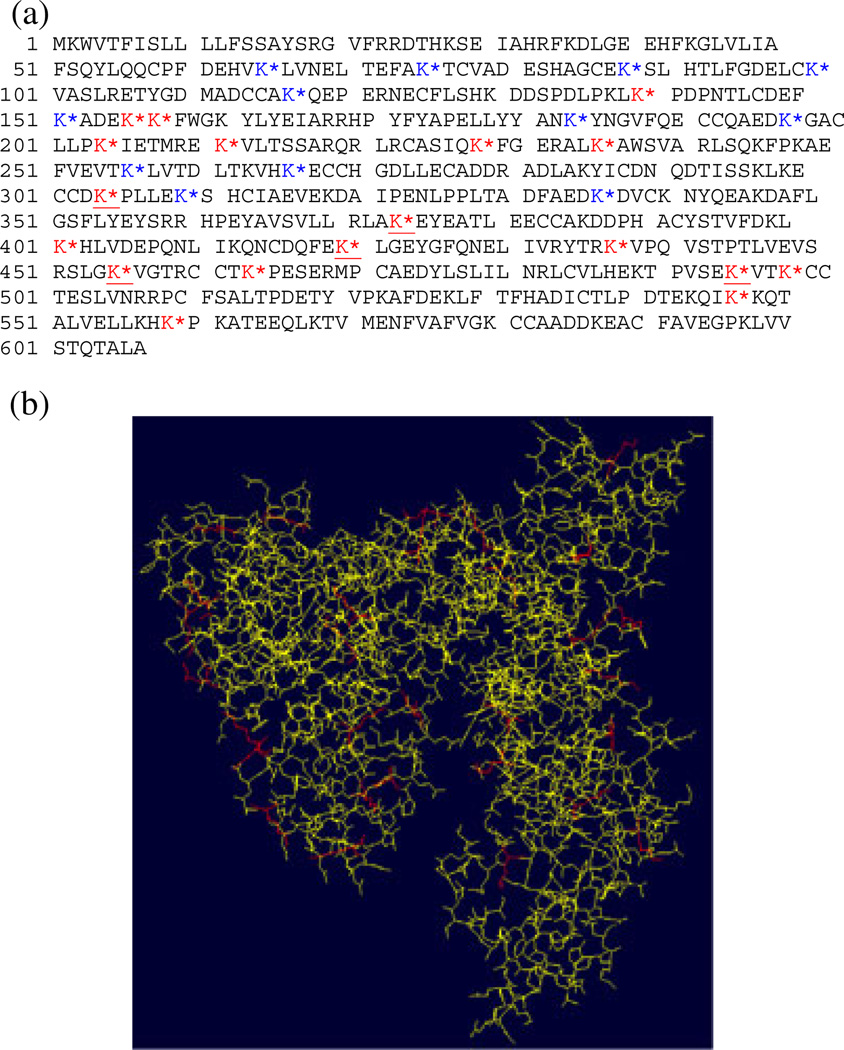
Figure 6.
(a) BSA sequence where the glycation sites are indicated by an asterix (red = identified on tryptic digests, blue = identified on GluC V8 digests and red and underlined = identified on both tryptic and GluC V8 digests) and (b) 3D-structure of the BSA. The glycated lysine residues are highlighted in red (Swiss-Pdb Viewer software).

