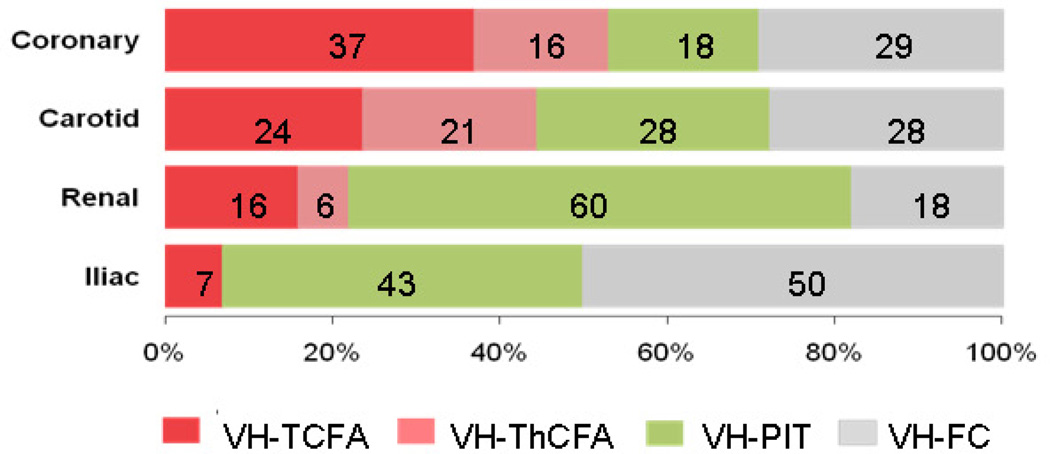
Figure 1.
The frequencies of plaque phenotypes in each vascularture. The distribution of plaque phenotypes was different among four vascular beds (P<0.001). Plaques demonstrated less characteristics of VH-FA (both VH-TCFA and VH-ThCFA) in renal (p<0.001 vs. coronary) and iliac arteries (p=0.006 vs. coronary). VH-FA= fibroatheroma; VH-TCFA=thin-capped fibroatheroma; VHThCFA= thick-capped fibroatheroma; PIT=pathological intimal thickening; and VH-FC=fibrocalcific plaque.

