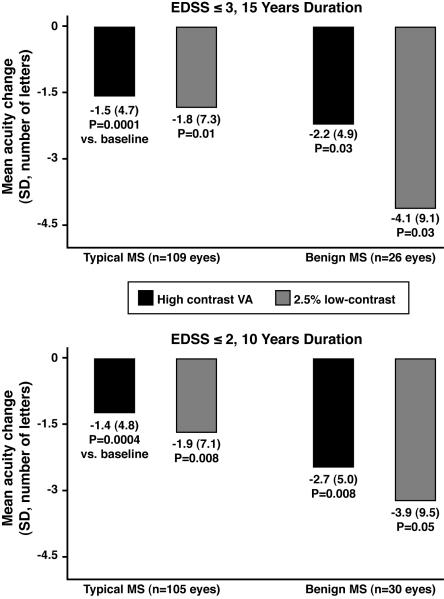
FIG. 2.
High-contrast visual acuity (VA, ETDRS charts) and low-contrast letter acuity loss from baseline at 2.5% contrast level for eyes of patients with benign vs. typical MS, using two definitions for benign MS.
Abbreviations: MS = multiple sclerosis; EDSS = Expanded Disability Status Scale; ETDRS = Early Treatment Diabetic Retinopathy Study
* P values are based on paired t-tests comparing baseline to follow-up values for high-contrast visual acuity (VA) and low-contrast letter acuity at 2.5% contrast.

