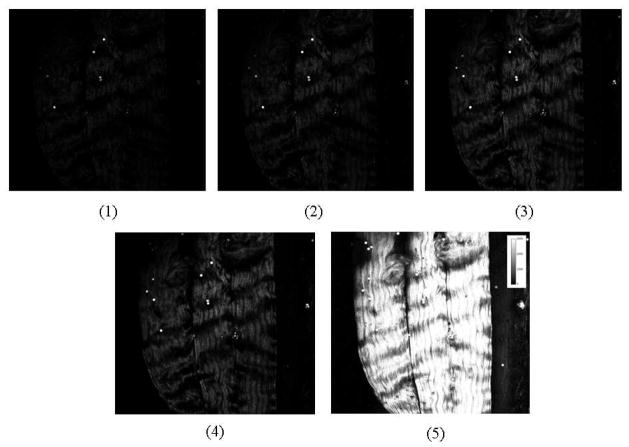
Fig. 7.
In vivo SHG images of rat tail collagen fibers in an intact rat tail. Images 1–5 are SHG images of the same ROI when the size of the pinhole varied from 60um, 100um, 150um, 200um, to 7000um, respectively. The bright spots are blue fluorescent polystyrene beads for calibration. Images are 600 um across.

