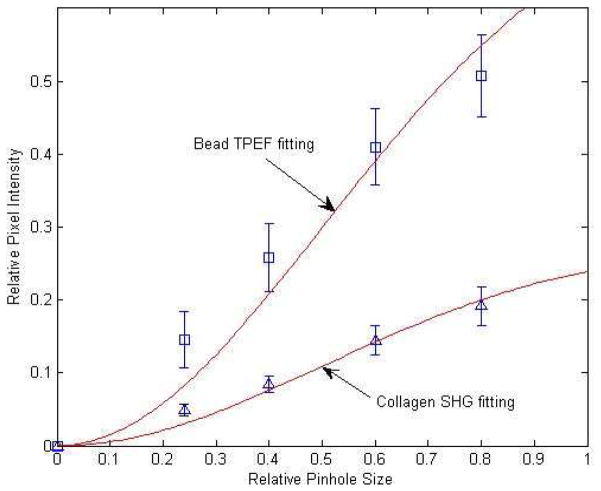
Fig. 8.
Epidetected total collagen SHG intensity (blue triangles), or total bead TPEF intensity (blue squares) vs. pinhole size, fit to the model given by Eq. (4) (red lines). The horizontal axis is pinhole size in units of backward propagating SHG spot size on the pinhole plane i.e. fraction of. The vertical axis is normalized SHG intensity. Note that the fitting curves identically equal 1 when the pinhole size reaches R = 28, whose data point is not shown, and that the intensity information for R = 28 provides the normalization value and hence is included in the overall fit.

