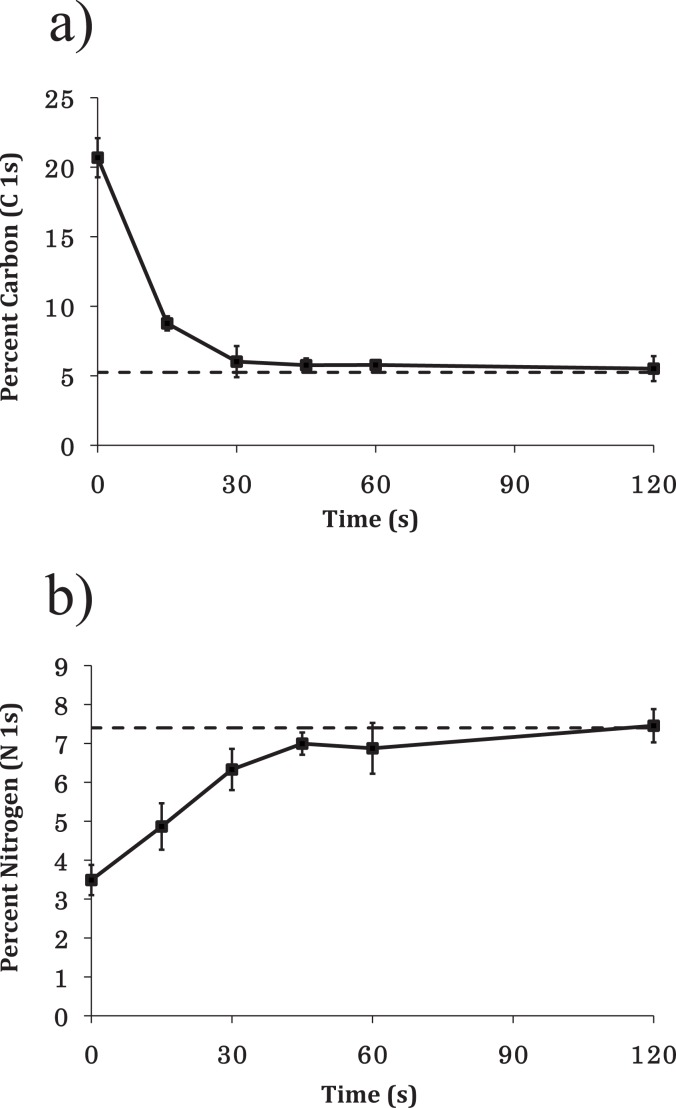
Figure 4.
(a) Atomic percent of C 1s signal vs ablation time. After 30 s atomic percent of C 1s was comparable to that of clean Si (dashed line). (b) Atomic percent of N 1s signal vs ablation time. Ablated samples were reacted with 0.1% DETA for 30 min to form a monolayer of DETA in the ablated regions. The graph shows nitrogen content (from N 1s high resolution spectra) vs ablation time. The dashed line indicates nitrogen content measured from control DETA samples.

