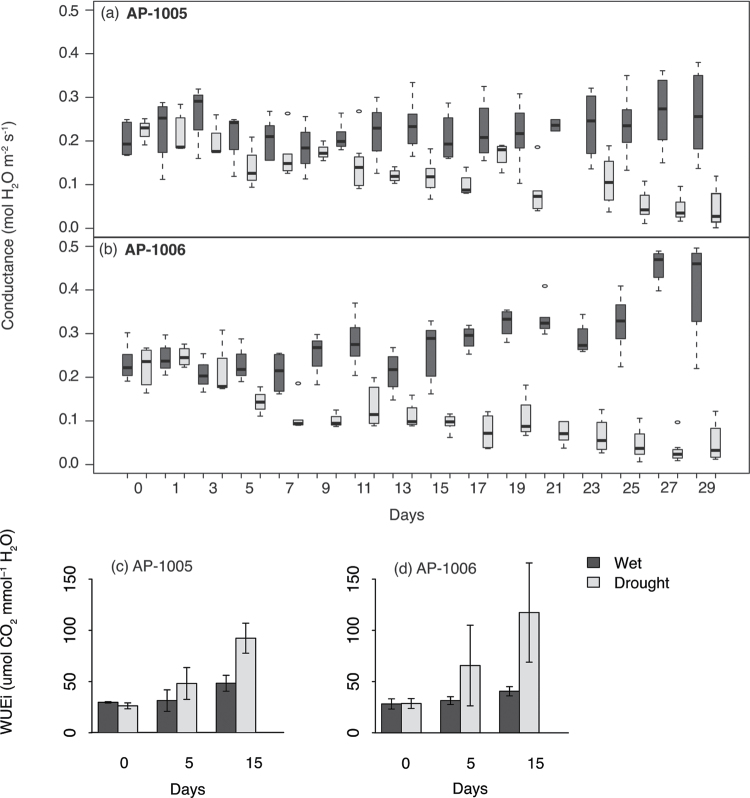
Fig. 2.
Variation in the physiological response to drought stress in genotype AP-1005 and AP-1006. Box plot of the variation in midday stomatal conductance for (a) AP-1005 and (b) AP-1006 for well-watered (shaded boxes) and water-deficit-treated (white boxes) samples. Response of intrinsic water use efficiency (WUEi; A/g s) across well watered and water-deficit-treated samples for (c) AP-1005 and (d) AP-1006 at days 0, 5, and 15.

