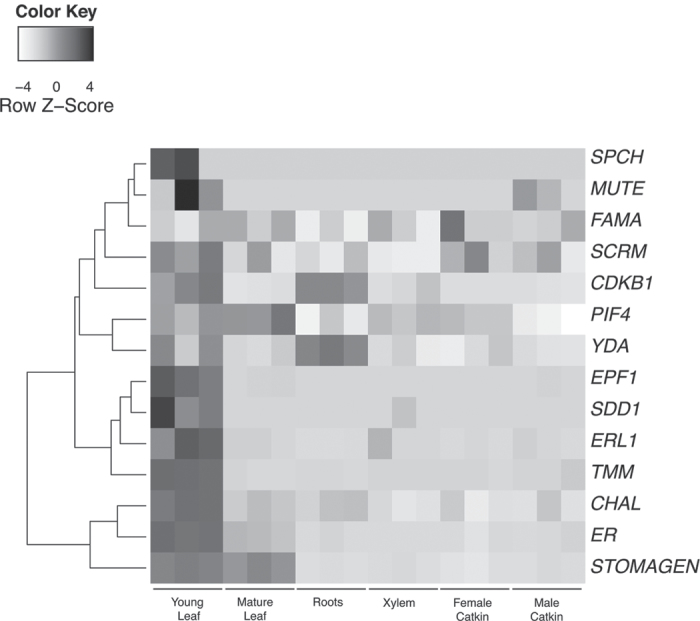
Fig. 4.
Heat map of transcript abundance across a range of tissues for Populus homologues of genes implicated in stomatal differentiation and patterning. Transcript accumulation for the 14 Populus homologues that had differential transcript abundance across the dataset, was derived from the PopGenExpress microarray compendium made available via http://bar.utoronto.ca (Wilkins et al., 2009a). As per the scale provided, elevated transcript abundance is represented by dark grey and diminished transcript abundance is represented by light grey. The highest levels of transcript abundance for this group of genes are in young leaves in contrast to other tissue types. Each column represents a discrete biological sample, and data are represented as biological triplicate replicates for each tissue type. Data are row normalized.

