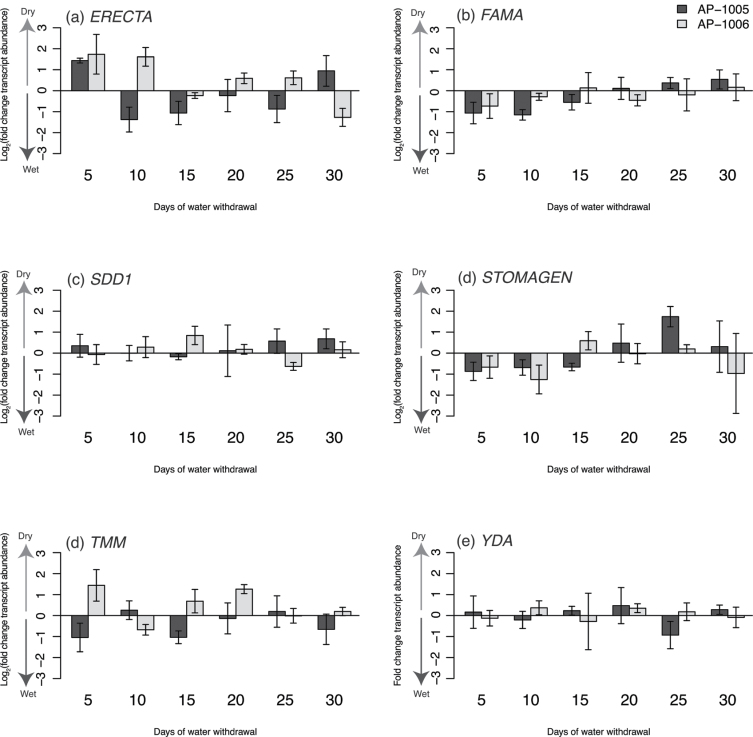
Fig. 5.
Variation in transcript abundance between well-watered and water-deficit-treated trees at six time points (days 5, 10, 15, 20, 25, and 30) for genotype AP-1005 (dark grey) and AP-1006 (light grey) represented by the log2 (fold change transcript abundance) for genes involved in stomatal development. A positive log2 (fold change transcript abundance) value is an indicator of higher transcript abundance in water-deficit-treated samples, whereas a negative log2 (fold change transcript abundance) value is an indicator of lower transcript abundance in water-deficit-treated samples.

