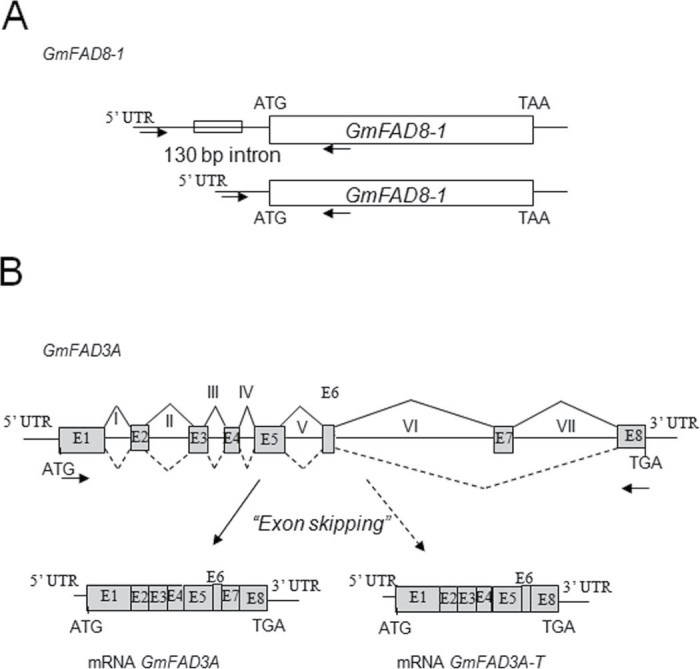
Fig. 5.
Schematic diagram showing the proposed alternative splicing mechanisms observed during the expression analysis of GmFAD8-1 (A) and GmFAD3A (B). Boxes represent exons while introns are represented by lines and numbered in Roman numerals. The positions of the ATG and stop codons as well as the primers used for amplification are also shown.

