Fig. 3.
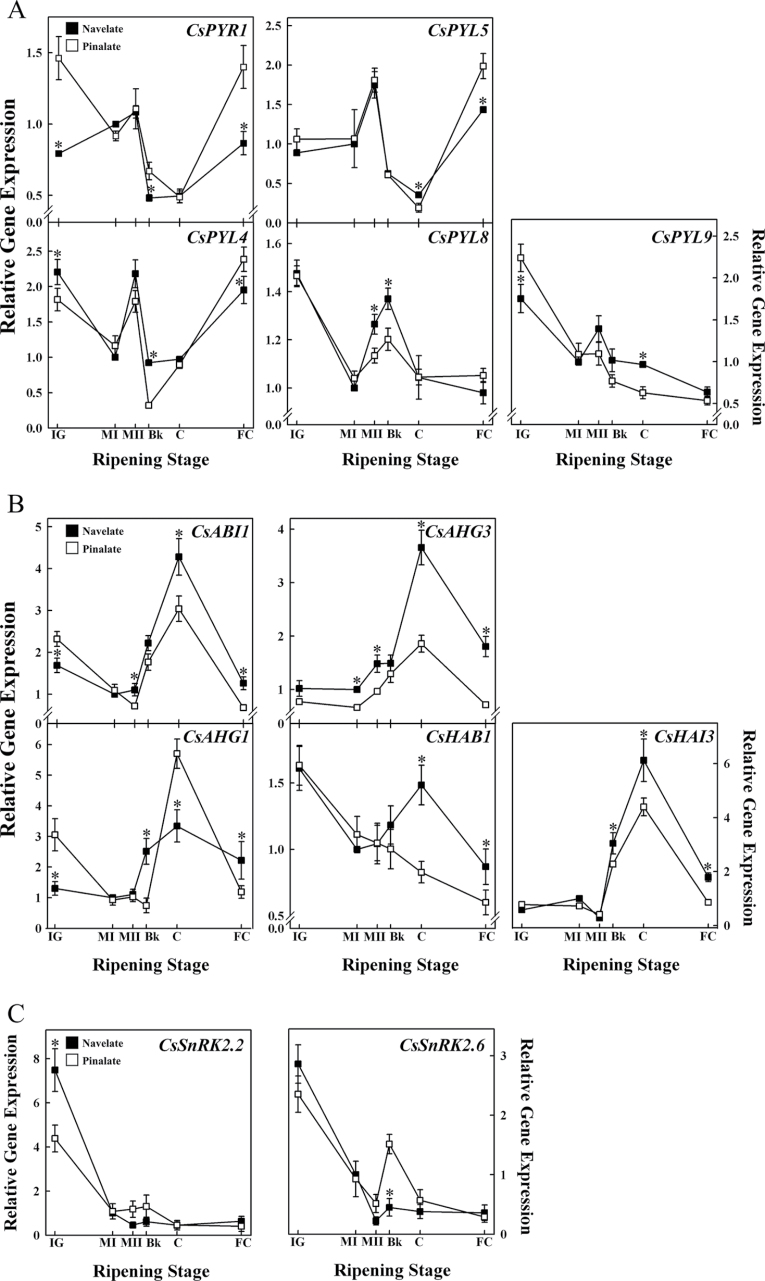
Relative gene expression analysis by qRT-PCR of Citrus PYR/PYL/RCAR ABA receptors (A), clade-A PP2Cs (B), and subclass III SnRK2s (C) in ‘Navelate’ (black) and ‘Pinalate’ (white) fruits during fruit development and ripening (immature green, IG; mature green I, MI; mature green II, MII; breaker, Bk; coloured, C; full coloured, FC). Expression values are relative to transcript levels obtained in MI ‘Navelate’ fruits. Values are mean ratios ±SE from three biological samples for each sampling period and variety analysed in duplicate. Significant differences (P ≤ 0.05) in gene expression between ‘Navelate’ and ‘Pinalate’ flavedo samples for the same maturity stage are indicated by an asterisk.

