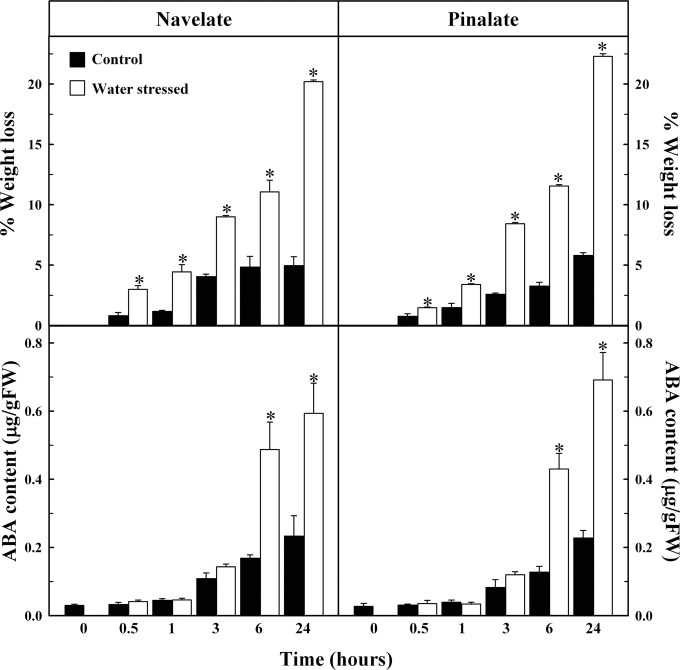
Fig. 4.
Effect of water stress on weight loss and ABA content in ‘Navelate’ and ‘Pinalate’ detached leaves. Changes in control samples are represented as black bars and in water-stressed leaves as white bars. The results are the means of three biological replicates of four leaves each ±SE. Significant differences (P ≤ 0.05) in weight loss and ABA content between samples for the same analysed period are indicated by an asterisk.

