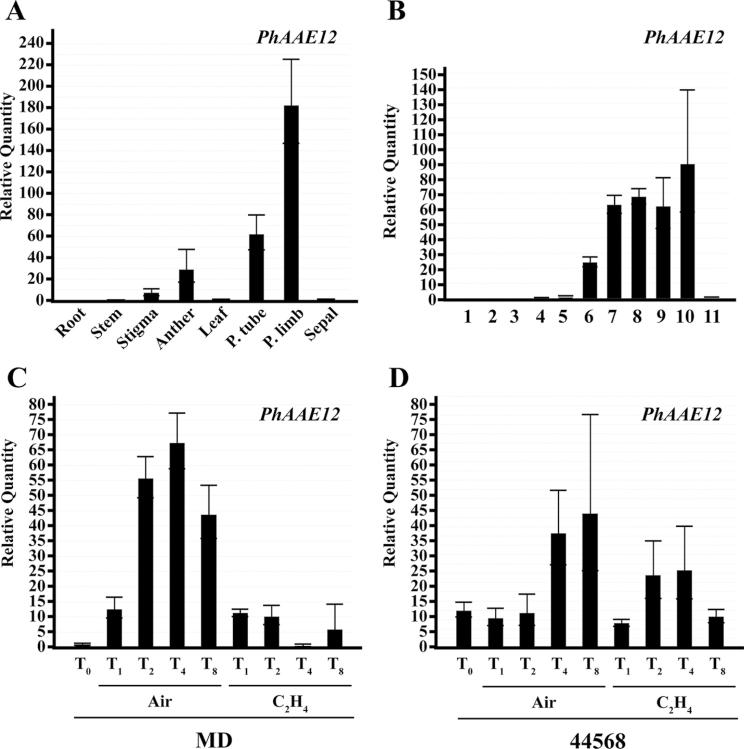
Fig. 3.
PhAAE transcript accumulation analysis (one-step qRT-PCR). Spatial analysis used root, stem, stigma, anther, leaf, petal tube, petal limb, and sepal tissues of MD harvested at 16.00h (A). Floral developmental analysis used MD flowers from 11 sequential stages collected on one day at 16.00h (B). Ethylene treatment (2 µl l–1 analysis used excised MD and 44 568 whole flowers treated for 0, 1, 2, 4, and 8h (C, D). 50ng total RNA was used per reaction in all cases. Histograms are representative of multiple experiments and multiple biological replicates, and analyzed by the ∆∆Ct method with PhFBP1 and Ph18S as the internal references (mean±SE; n=3).

