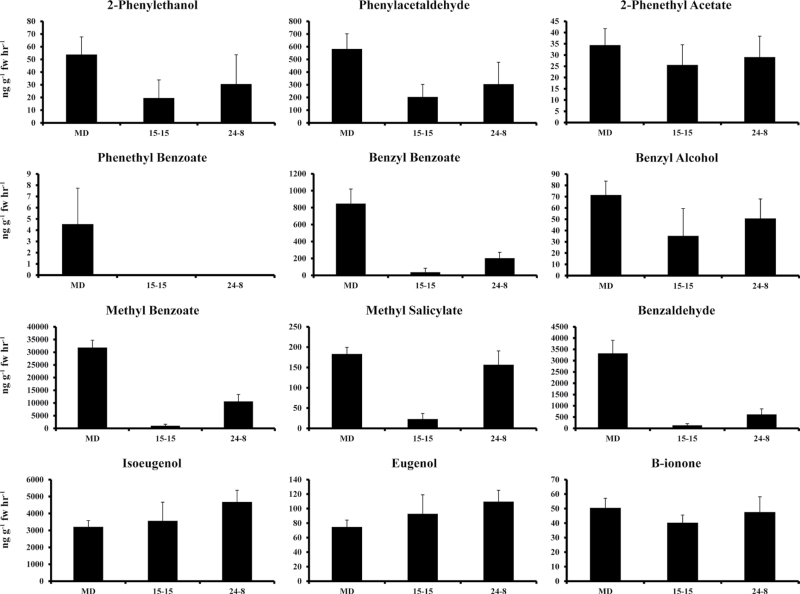
Fig. 6.
FVBP emission analysis of representative plants from two independent, homozygous T2 ir-PhAAE lines (15.15 and 24.8) and MD. Developmentally staged flowers (stage 8) were used to collect FVBP emission at 18:00h (mean±SE; n=3). Twelve major FVBP compounds were identified and quantified with all measurements ng g–1 FW h–1.

