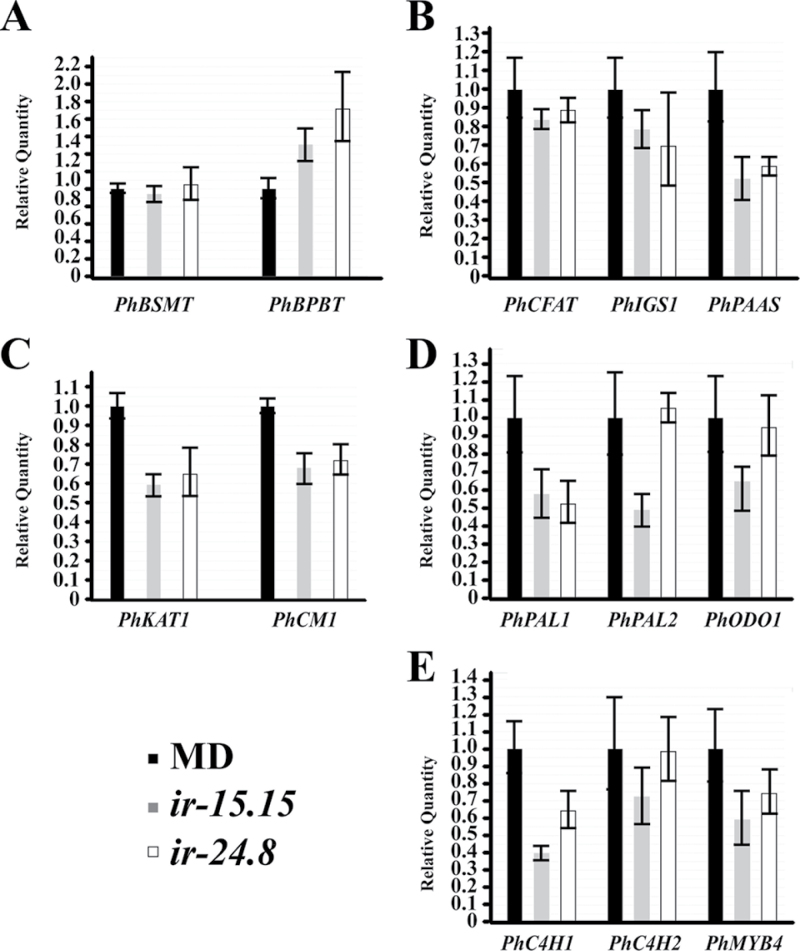
Fig. 7.
PhAAE comparative transcript accumulation analysis between MD and two independent, homozygous T2 ir-PhAAE lines (15.15 and 24.8). 50ng total RNA was used per reaction in all cases for one-step qRT-PCR with RNA isolated from stage 8 flowers at 16.00h. Histograms are representative of multiple experiments and multiple biological replicates, and analyzed by the ∆∆Ct method with PhFBP1 and Ph18S as the internal references. The individual petunia transcripts analyzed are PhBSMT, PhBPBT, PhCFAT, PhIGS1, PhPAAS, PhKAT1, PhCM1, PhPAL1, PhPAL2, PhODO1, PhC4H1, PhC4H2, and PhMYB4 (mean±SE; n=3).

