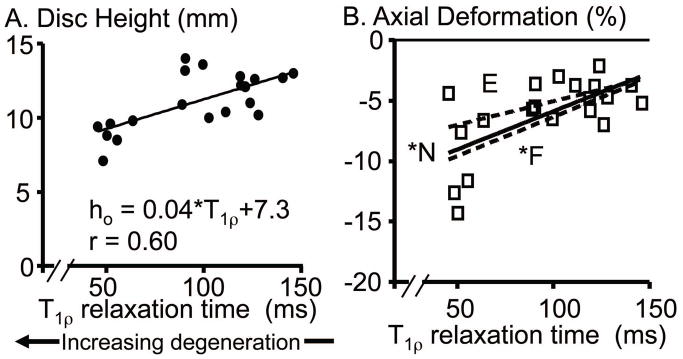
Figure 7.
A) Correlation with degeneration of the initial disc height in the reference image. B) Correlation of axial deformation with degeneration. Axial deformation data for flexion and extension are shown in the supplementary figure available online (S – Figure 7). F: Flexion position is shown as a dashed line, N: neutral position is represented by the squares with solid line, and E: extension position is shown by the dashed line. * p < 0.05.

