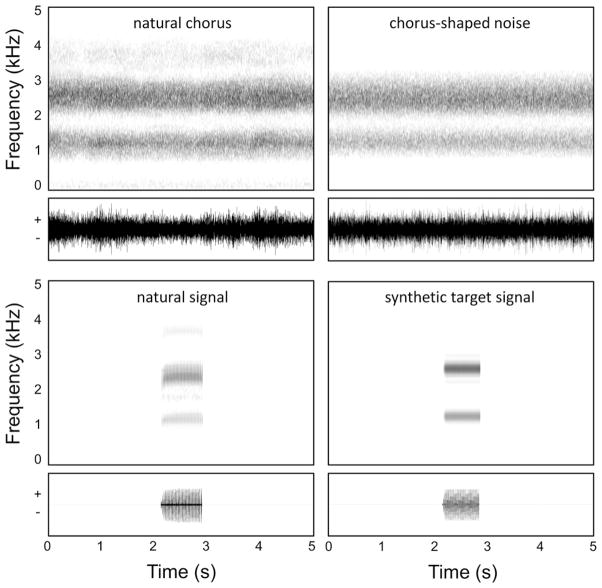
Fig. 1.
Natural and artificial choruses and signals. The left column depicts spectrograms (top traces) and waveforms (bottom traces) of a segment of a natural gray treefrog chorus (top left panel) and a natural gray treefrog advertisement call (bottom left panel). The right column depicts spectrograms (top trace) and waveforms (bottom trace) of an exemplar of chorus-shaped noise used in the masking experiment (top right panel) and the bimodal target signal (bottom right panel).

