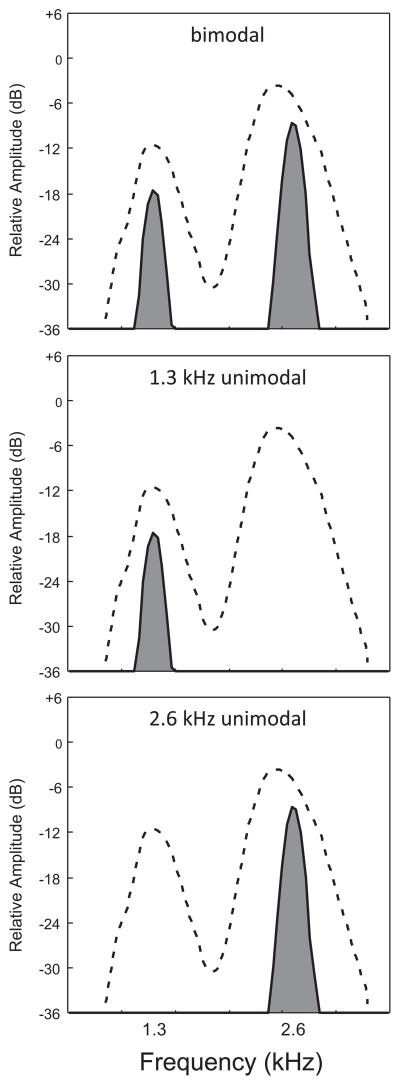
Fig. 2.
Spectra of the three target signals in relation to the spectrum of chorus-shaped noise. Each plot shows the spectrum of a single target signal (shaded gray) and that of an exemplar of chorus-shaped noise used as a masker (area under the dashed line). The bimodal target signal is shown in the top panel and the two unimodal signals with carrier frequencies of 1.3 kHz and 2.6 kHz are shown in the middle and bottom panels, respectively.

