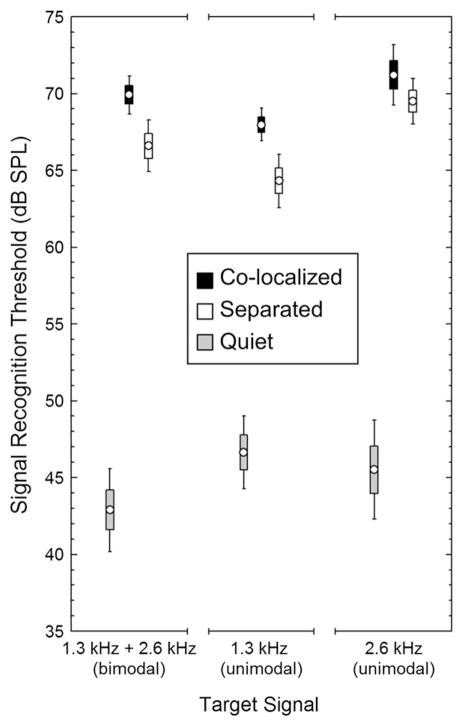
Fig. 4.
Signal recognition thresholds. Depicted here are the mean (points), ± s.e.m. (boxes), and ±95% confidence intervals (whiskers) for signal recognition thresholds in quiet conditions (gray) and for masked signal recognition thresholds determined in the co-localized (black) and 90° separated (white) spatial configurations.

