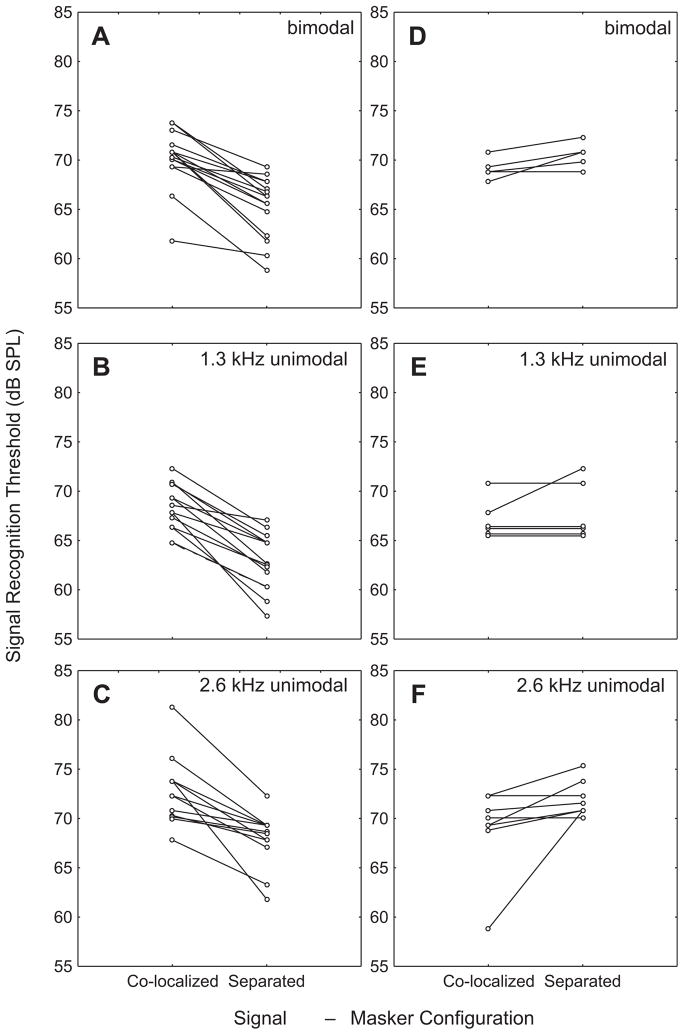
Fig. 5.
Variability in masked signal recognition thresholds and spatial unmasking across noise exemplars. Plots A–C depict data for those combinations of target signal and noise exemplar that yielded relatively lower signal recognition thresholds in the separated configuration compared with the co-localized configuration. Plots D–F show equivalent data for the remaining combinations of target signal and noise exemplar for which thresholds in the separated configuration were the same as or higher than those in the co-localized condition. Each point depicts the average of 1–3 individuals tested with a given target signal and noise exemplar in the specified signal-masker configurations; pairs of points connected by a line indicate the averages of the group of individuals tested within-subjects using the same target signal and noise exemplar in both the co-localized and separated configurations.

