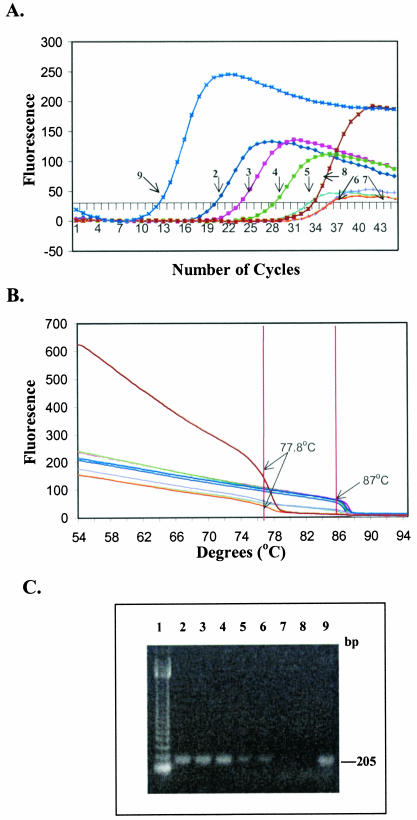
FIG. 2.
Real-time PCR sensitivity with primers L-vvh and R-vvh and genomic DNA extracted from 10-fold serially diluted pure cultures of V. vulnificus MO6-24(O) without enrichment. (A) Representative optic graph for the number of cycles versus the number of fluorescence units for each sample used to calculate the Ct value. (B) Corresponding melting curve analysis, with the results represented by a graph of number of fluorescent units versus temperature. (C) Corresponding agarose gel electrophoresis. Lane 1, 123-bp DNA ladder (Gibco, BRL); lane 2, 106 CFU/ml; lane 3, 105 CFU/ml; lane 4, 104 CFU/ml; lane 5, 103 CFU/ml; lane 6, 102 CFU/ml; lane 7, 101 CFU/ml; lane 8, PCR-negative control; lane 9, PCR-positive control. The lane numbers correspond to the sample numbers shown in Table 4.

