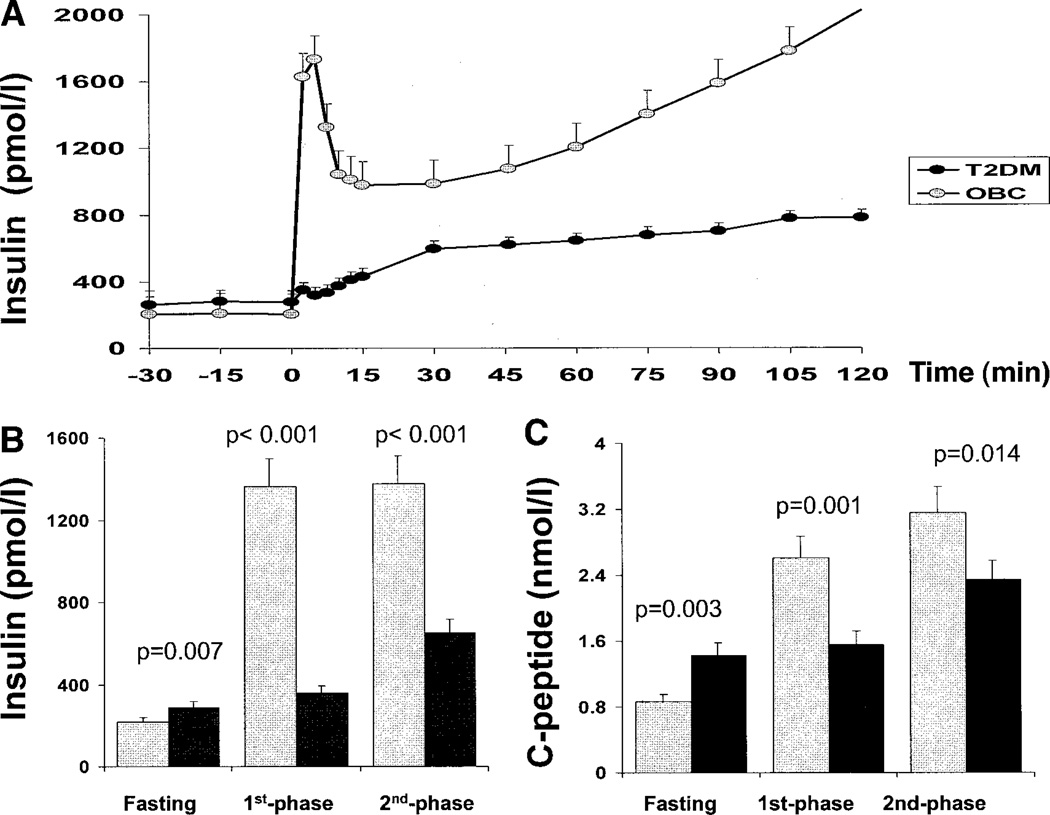
Figure 2.
Insulin levels during the hyperglycemic clamp (A), mean of fasting, first-phase, and second-phase insulin levels (B), and mean of fasting, first-phase, and second-phase C-peptide levels (C) during the hyperglycemic (12.5 mmol/l) clamp in type 2 diabetes (T2DM) patients versus obese control (OBC) subjects.

