Figure 5.
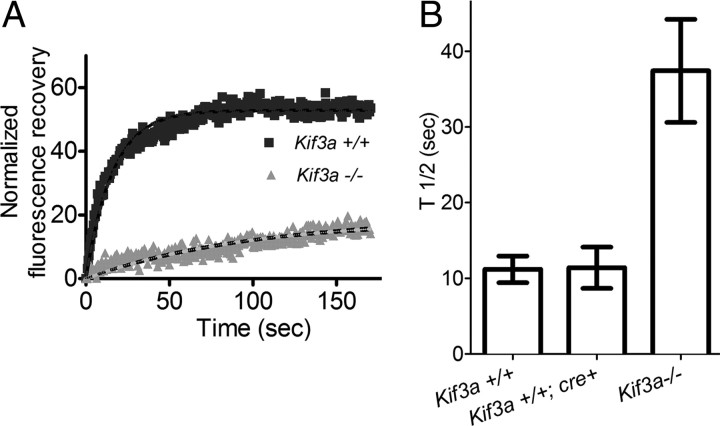
Reduction in FRAP of RHO-EGFP in the connecting cilium of Kif3a−/− mouse rod photoreceptor cells. A, Example of plot of normalized fluorescence recovery versus time for RHO-EGFP in the connecting cilia of Kif3a+/+ and Kif3a−/− rod photoreceptors (full genotypes: RHO-EGFP(KI);Rpe65−/−;RHO-Cre+ and RHO-EGFP(KI);Rpe65−/−;Kif3a flox/flox; RHO-Cre+, respectively). B, Bar graph of the measured half-times, t1/2, for recovery of RHO-EGFP in Kif3a+/+ and Kif3a−/− rod photoreceptors. Kif3a+/+;Cre+ represents RHO-EGFP(KI);Rpe65−/−;RHO-Cre+ (i.e., lacking the floxed gene, but with the Cre transgene). Measurements of t1/2 were 11.2 ± 1.7, 11.4 ± 2.7, and 37.4 ± 6.8 s, for Kif3a+/+ (n = 42), Kif3a+/+;Cre+ (n = 10), and Kif3a−/− (n = 24), respectively (p < 0.0001 for Kif3a+/+ vs Kif3a−/−, p < 0.01 for Kif3a+/+;Cre+ vs Kif3a−/−, p = 0.96 for Kif3a+/+ vs Kif3a+/+;Cre+).

