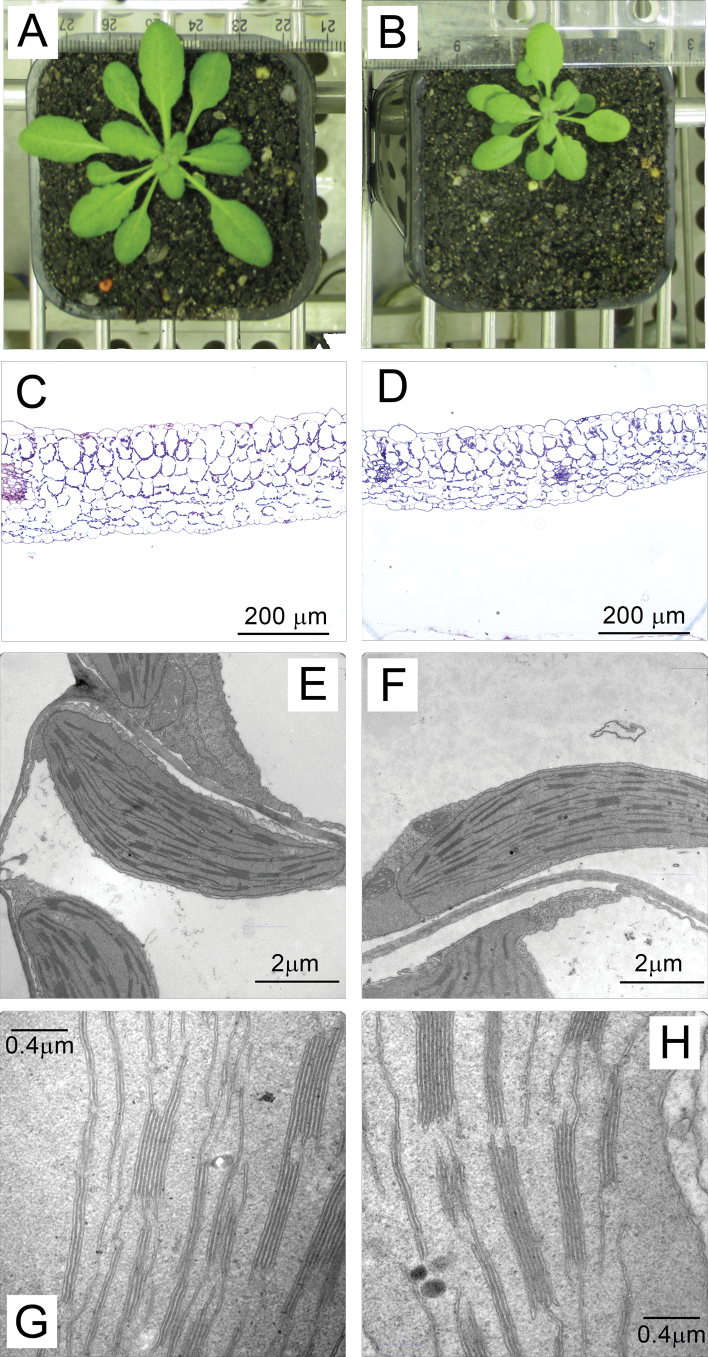
Fig. 3.
Examples of phenotypic differences between WT (A, C, E, G) and low PsbO (B, D, F, H) plants: (A, B) growth differences, (C, D) transverse leaf sections (magnification ×200), (E–H) chloroplasts from palisade cells. Refer to Table 1 for quantifications from microscopy images. Bars, 200 µm (C, D), 2 µm (E, F), 0.4 µm (G, H) (this figure is available in colour at JXB online).

