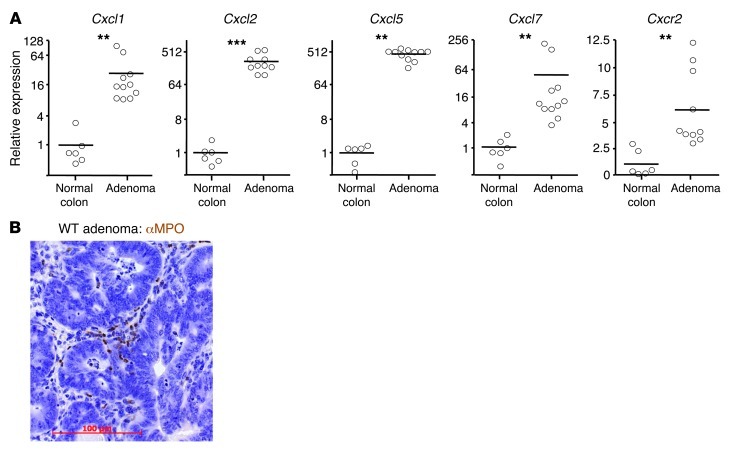
Figure 4. AOM/DSS-induced adenomas express CXCR2 ligands and are infiltrated by MPO+ cells.
WT Balb/c mice were treated once i.p. with AOM and then underwent 3 5-day periods of 2% DSS feeding, interspersed by 16 days on normal water. Animals were sacrificed 70 days after AOM injection. (A) Relative abundance of transcripts for Cxcr2 and its ligands in AOM/DSS-induced adenomas, as determined by Q-RT-PCR; mean expression in normal colon of untreated mice is set to 1. **P < 0.01, ***P < 0.001, Mann-Whitney test. (B) Representative adenoma section stained with anti-MPO Ab (brown), counterstained with hematoxylin, and visualized by light microscopy. Scale bar: 100 μm.

