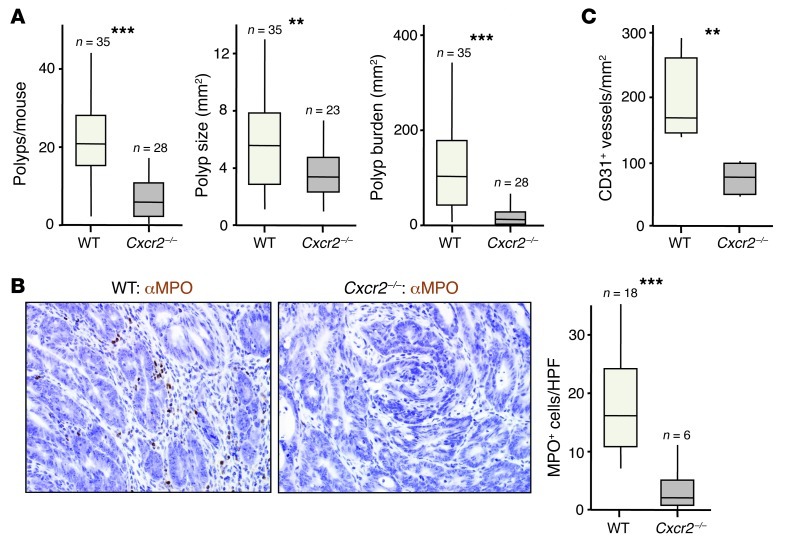
Figure 6. Cxcr2 deficiency suppresses AOM/DSS-induced adenoma formation.
WT and Cxcr2–/– mice were treated once i.p. with AOM and then underwent 3 5-day periods of 2% DSS feeding, interspersed by 16 days on normal water. Animals were sacrificed 70 days after AOM injection. (A) Number of colonic polyps per mouse, polyp size, and overall tumor burden per mouse (n as indicated). (B) Representative sections of AOM/DSS-induced adenomas from WT and Cxcr2–/– mice immunostained with anti-MPO (brown), counterstained with hematoxylin, and visualized by light microscopy. Number of MPO+ cells per high-powered field in sections of WT and Cxcr2–/– adenomas (n as indicated) is also shown. (C) Microvessel density in WT and Cxcr2–/– adenomas (n = 5–6 per group). **P < 0.01, ***P < 0.001, Mann-Whitney test. Box and whisker plots show median (lines within boxes), interquartile range (bounds of boxes), and upper and lower range (whiskers).

