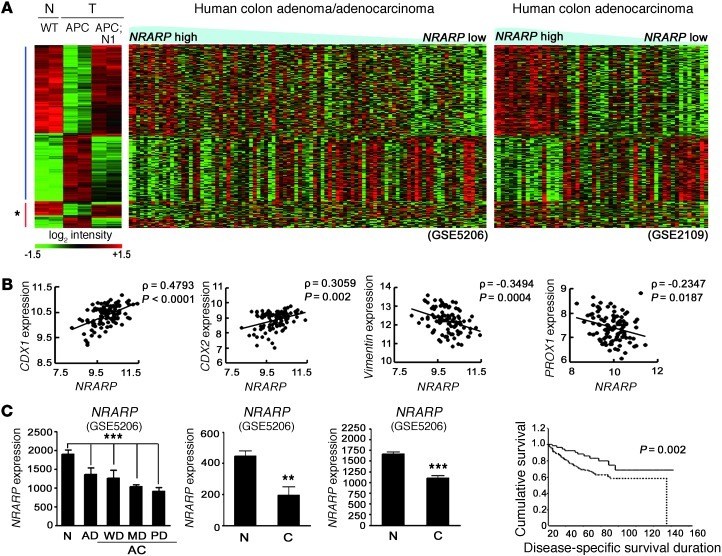
Figure 4. Conserved Notch signatures in both mouse and human intestinal tumors.
(A) Heat map comparison between Notch-responsive genes (clusters A and B in Figure 3A) from mouse models and microarray data sets from human CRC patients (GEO GSE5206 and GSE2109). Note that genes upregulated upon Notch activation in Apcmin tumors have higher expression levels in Nrarphi tumors compared with those of Nrarplo tumors and vice versa. Asterisk indicates the group of genes that do not correlate between mouse and human data. APC, Vil-Cre;Apcmin. (B) Positive correlation of CDX1 and CDX2 (transcription factor for epithelial differentiation) and negative correlation of VIMENTIN (epithelial-mesenchymal transition marker) and PROX1 (tumor progression related gene) with Nrarp, respectively. ρ, correlation coefficient. Statistics are by Pearson’s correlation. (C) Expression levels of Nrarp in the 3 independent microarray data sets (GEO GSE5206, GSE4107, and GSE 8671). AD, adenoma; AC, adenocarcinoma; WD, well differentiated; MD, moderately differentiated; PD, poorly differentiated; C, cancer. Note the reduced Nrarp expression in CRCs compared with normal tissue. ***P < 0.001; **P < 0.005. Statistics for far-left graph are by ANOVA. (D) Positive correlation between Nrarp expression and patient survival from microarray data set (GEO GSE17538). The Kaplan-Meier method was used to estimate survival of the 2 groups; Nrarphi (solid line) and Nrarpmid/lo (dotted line).

