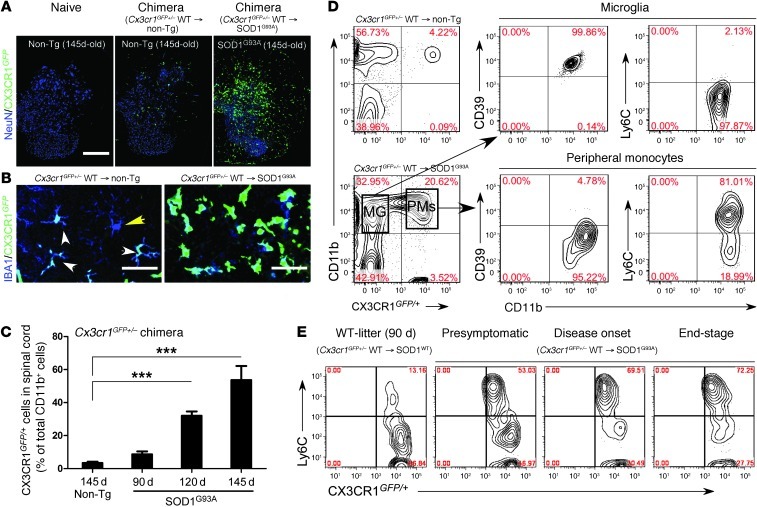
Figure 10. Reciprocal expression of CD39 and Ly6C in CNS-resident microglia and bone marrow–derived monocytes in SOD1 chimeric mice.
SOD1G93A and non-Tg littermates were transplanted with syngeneic bone marrow cells from CX3CR1GFP/+ mice. Spinal cords were analyzed at presymptomatic (60 days), disease onset, and end stages. (A) GFP+ recruited IBA1+ monocytes in lumbar spinal cord of non-Tg– and SOD1-Cx3cr1GFP+/– mice. Scale bar: 500 μm. (B) Confocal images of GFP+ recruited monocytes (IBA1+GFP+; white arrowheads) and resident microglia (IBA1+GFP–; yellow arrowhead) in ventral horns of non-Tg– and SOD1-Cx3cr1 chimeric mice at 120 days of age. Representative confocal images (5–6 mice per group). Scale bars: 50 μm. (C) Quantitative analysis showing the kinetics of bone marrow–derived CX3CR1GFP/+ monocytes recruited into spinal cords during disease at 90, 120, and 145 days of age in SOD1-Cx3cr1GFP+/– chimeric mice. Data represent mean ± SEM (5–6 mice per group). ***P < 0.001, 1-way ANOVA followed by Dunnett’s multiple-comparison post hoc test. (D) FACS analysis of CD39 and Ly6C expression in spinal cord–derived populations of microglia (MG) and peripheral monocytes (PMs) isolated from non-Tg– and SOD1-chimera mice at 120 days of age. Note: CD11b+GFP+ gated peripheral monocytes express Ly6Chi and do not express CD39, whereas all resident microglia express CD39 and are negative for Ly6Chi. (E) Expansion of the recruited Ly6ChiCX3CR-GFPlo monocyte subset in the spinal cord of SOD1 mice during disease progression. Numbers in D and E represent the percentage of CD11b-gated cells in each quadrant. Each panel represents a pool of 4–5 mice.

