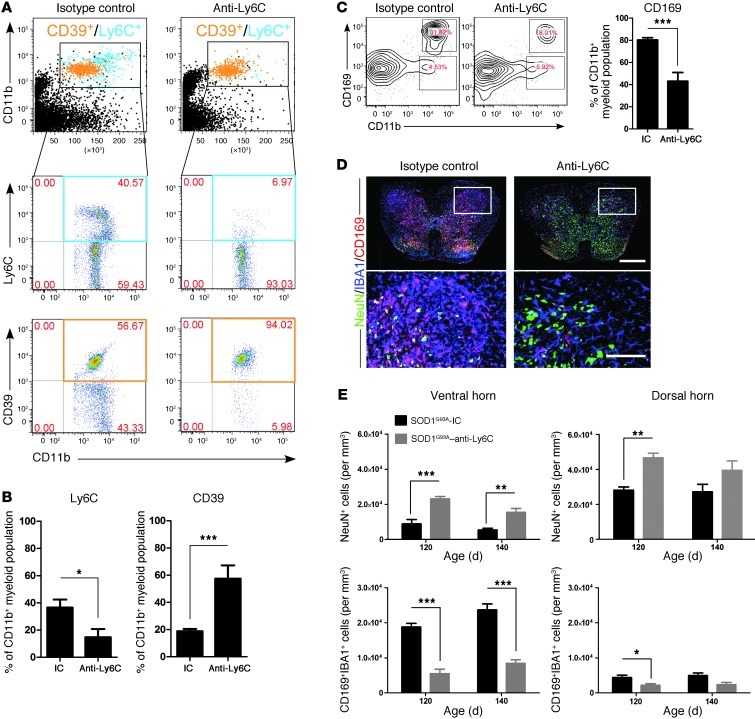
Figure 14. Anti-Ly6C mAb treatment decreases infiltration of Ly6Chi monocytes into the spinal cord and attenuates neuronal loss.
SOD1 mice were treated as described in Figure 12. (A) FACS analysis of Ly6C+ monocytes in the spinal cord of anti-Ly6C–treated SOD1 mice compared with the IC group 30 days after treatment. Cells were gated using Annexin V and 7-AAD to eliminate apoptotic and necrotic cells. Numbers represent the percentage of CD11b-gated cells in each respective quadrant as indicated. Pooled data from 5 mice are shown. (B) Significantly reduced proportion of Ly6C+ monocytes and increased numbers of CD39+ microglia among CD11b+ cells 50 days after α-Ly6C treatment. (C) Significant reduction in CD11b+CD169+ monocytes was detected after 50 days of α-Ly6C treatment. Numbers represent the percentage of cells in each gate. (D) Representative confocal images stained for NeuN (green; neurons), IBA1 (blue; myeloid cells), and CD169 (red; recruited monocytes) of whole mount lumbar axial sections of spinal cords from IC- and Ly6C-treated mice at the end stage (140 days old). Scale bar: 500 μm. Boxed areas showed insets at high magnification. Scale bars: 200 μm. (E) Quantitation of neurons (NeuN+) and recruited monocytes (IBA1+/CD169+) in ventral and dorsal horns in the spinal cord of SOD1 mice treated with isotype control or anti-Ly6C mAbs (n = 6–8 per group). Results are representative of 2 independent experiments. Error bars represent mean ± SEM. *P < 0.05, **P < 0.01, ***P < 0.001, Student’s t test (2-tailed).

