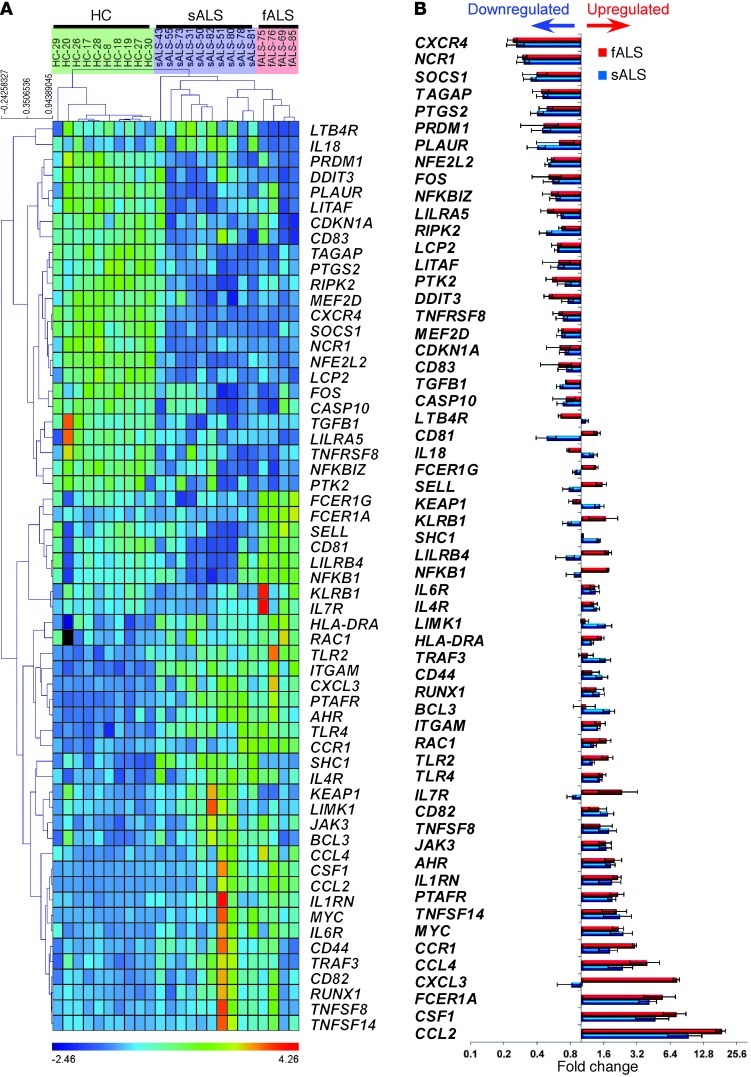
Figure 17. Immune gene profiling of peripheral monocytes (CD14+CD16–) in ALS patients.
Quantitative nCounter expression profiling of CD14+CD16– monocytes for 511 immune- and 184 inflammation-related genes in sALS (n = 10) and fALS-SOD1 patients (n = 4) versus healthy controls (n = 10). (A) Heatmap of unsupervised hierarchical clustering (Pearson correlation) shows significantly affected genes (P < 0.01, nonparametric Kruskal-Wallis test, significance based on FDR Benjamini-Hochberg; selected FDR limit, 0.05). (B) Bars show fold differences of significantly affected genes in sALS and fALS subjects versus healthy controls. Gene expression level was normalized against the geometric mean of 15 internal-reference housekeeping genes (ABCF1, ALAS1, EEF1G, G6PD, GAPDH, GUSB, HPRT1, OAZ1, POLR1B, POLR2A, PPIA, RPL19, SDHA, TBP, TUBB). Data represent mean ± SD. All shown miRNAs were significantly affected (P < 0.05). The complete list of P values for each significantly affected miRNA is shown in Supplemental Table 5.

