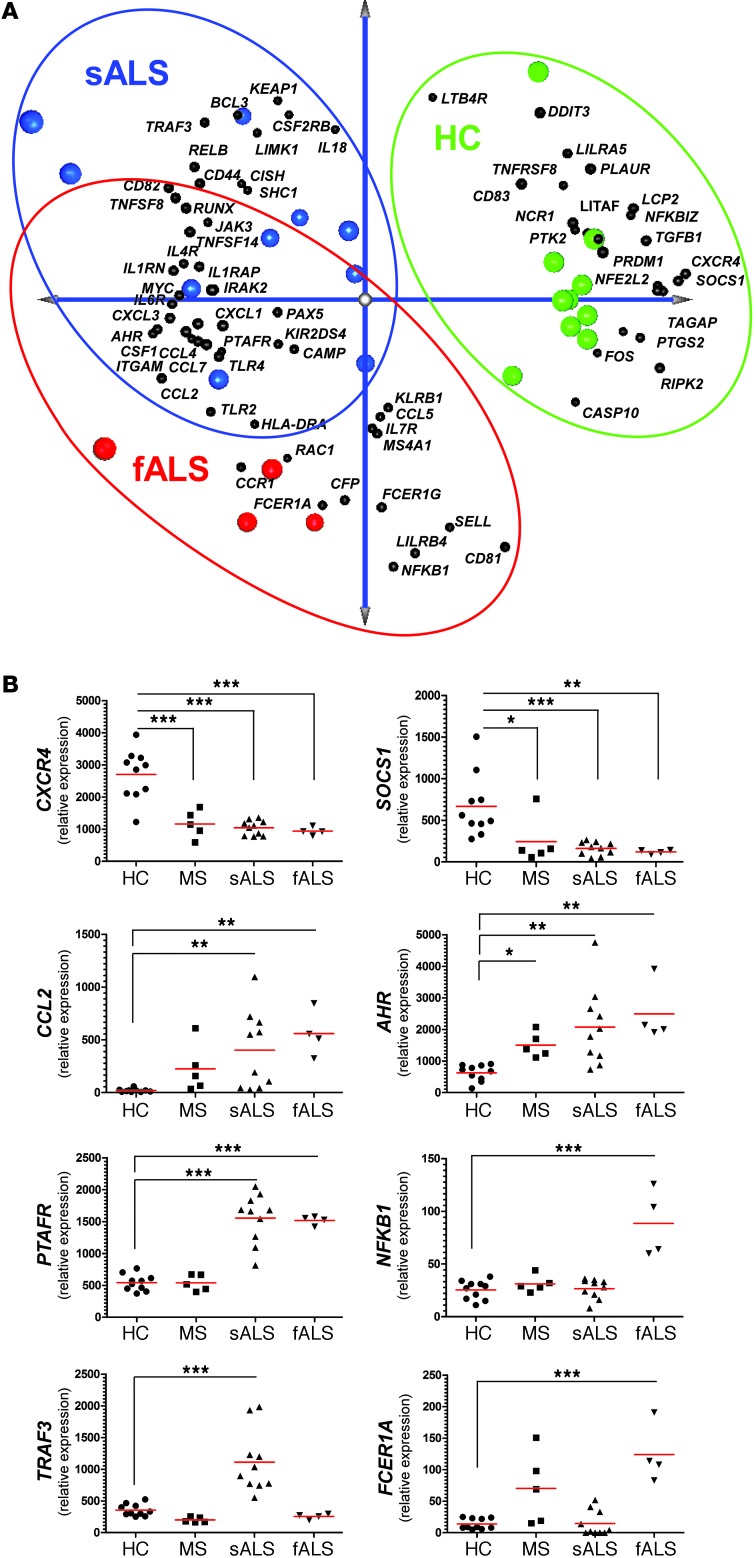
Figure 18. Identification of a unique gene signature in CD14+CD16– blood monocytes from ALS subjects.
(A) PCA analysis of the identified affected genes between sALS and fALS subjects versus healthy controls with spatial gene distribution. (B) qRT-PCR validation of 8 selected genes in an independent cohort that were the most significantly upregulated or downregulated. Relative expression in sALS and fALS against healthy controls were calculated using the 2–ΔΔCt method. Gene expression level was normalized against the geometric mean of 3 housekeeping genes (GAPDH, TUBB, and GRB2). PCRs were run in duplicate per subject. Each data point represents an individual subject. Horizontal bars denote mean of gene expression for each group. **P < 0.01, ***P < 0.001, 1-way ANOVA followed by Dunnett’s multiple-comparison post hoc test.

