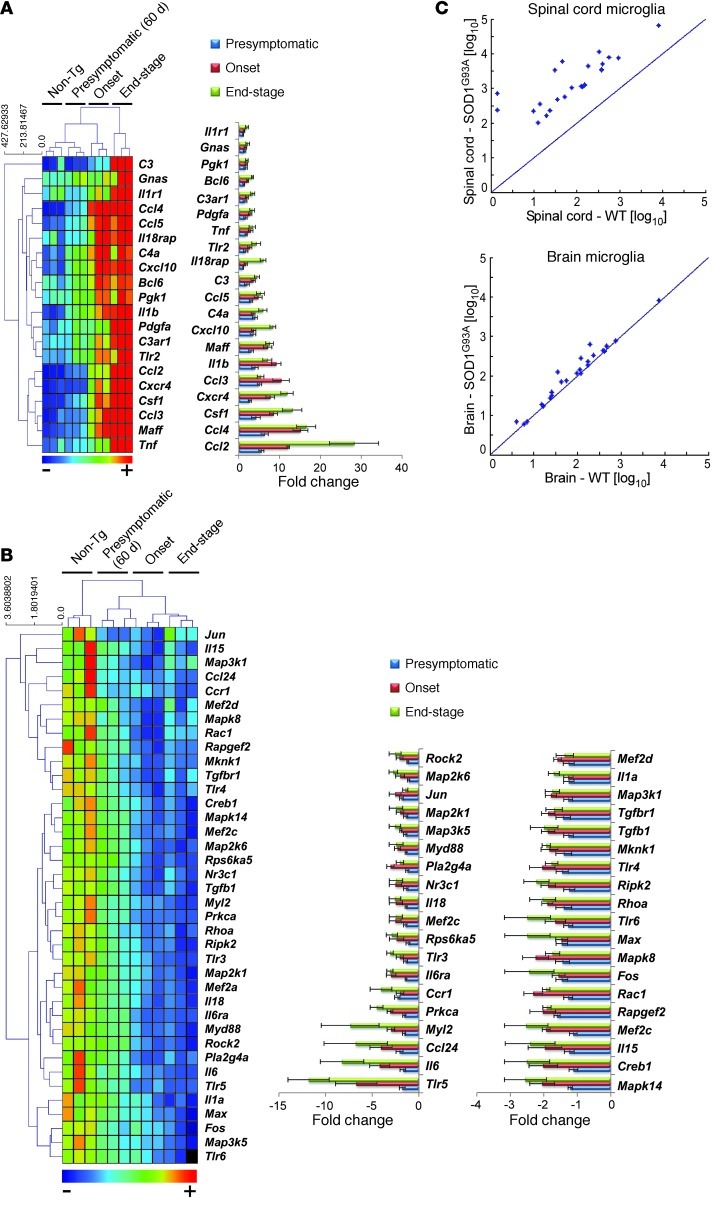
Figure 2. Activation of the chemotaxis pathway in CD39+ resident microglia in the spinal cord but not the brain of SOD1 mice.
(A) Quantitative nCounter expression profiling of 179 inflammation-related genes was performed in spinal cord–derived CD39+ microglia from SOD1 mice and compared with non-Tg littermates at presymptomatic (60 days), onset (defined by body weight loss), and end stages. Heatmap shows genes with at least 2-fold-altered transcription levels. Each row of the heatmap represents an individual gene and each column an individual group in biological triplicate (n = 3 arrays for each group from pool of 4–5 mice at each time point). The relative abundance of transcripts is indicated by a color scale (red, high; green, median; blue, low). Bars show relative expression of significantly up- or downregulated genes in SOD1 mice from non-Tg littermates at each time point. Twenty significantly upregulated genes are shown in A, and 38 significantly downregulated genes are shown in B. Data for A and B represent mean ± SD. All shown genes were significantly affected (P < 0.05). The complete list of P values for each significantly affected gene is shown in Supplemental Table 1. Gene expression level was normalized against the geometric mean of 6 housekeeping genes (Cltc, Gapdh, Gusb, Hprt1, Pgk1, Tubb5). (C) Comparative analysis of significantly upregulated genes in CD39+ microglia from spinal cords of SOD1 mice at onset versus microglia isolated from the brain of the same mice.

