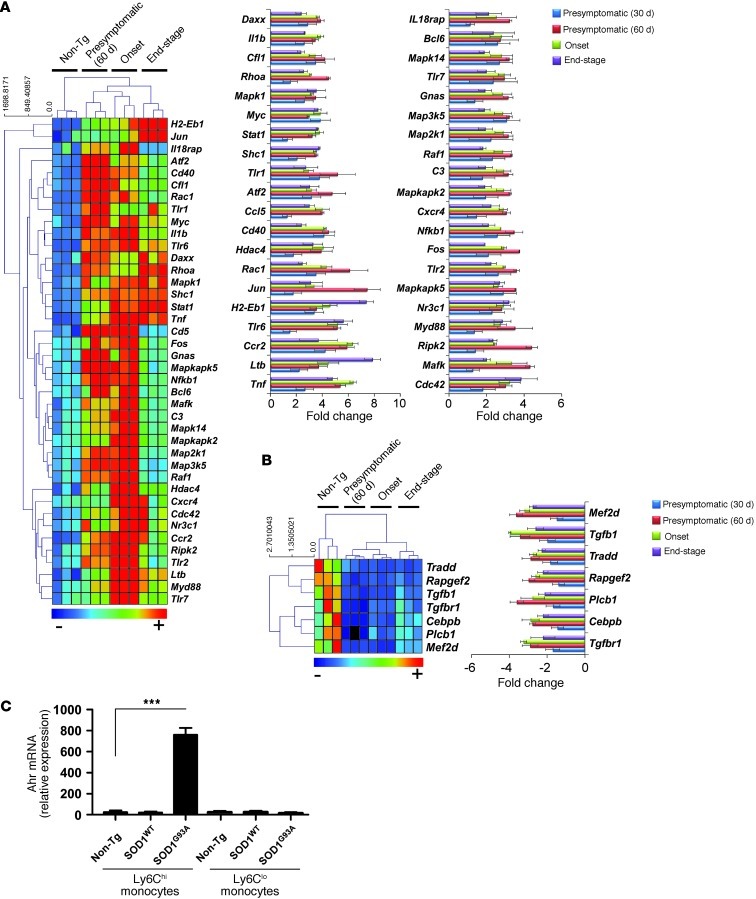
Figure 3. Ly6Chi monocytes in the spleen exhibit a proinflammatory profile 2 months prior to clinical disease onset and during disease progression in SOD1 mice.
Quantitative nCounter expression profiling of 179 inflammation-related genes showing significantly (A) upregulated and (B) downregulated genes in splenic Ly6Chi monocytes compared with non-Tg littermates of the same mice analyzed in Figure 2 at presymptomatic (30 and 60 days of age), disease onset, and end stages. Data for A and B represent mean ± SD. All shown genes were significantly affected (P < 0.05). The complete list of P values for each significantly affected gene is shown in Supplemental Table 2. Gene expression level was normalized against the geometric mean of 6 housekeeping genes (Cltc, Gapdh, Gusb, Hprt1, Pgk1, Tubb5). (C) qRT-PCR analysis of Ahr mRNA expression in splenic Ly6C monocyte subsets sorted by flow cytometry from non-Tg, SOD1WT, and SOD1G93A mice at disease onset. Total RNA was isolated and pooled from 3–5 mice for each cell population. Expression levels were normalized to Gapdh. Data represent mean ± SEM. ***P < 0.001, Student’s t test (2-tailed). Results are representative of 2 independent experiments.

