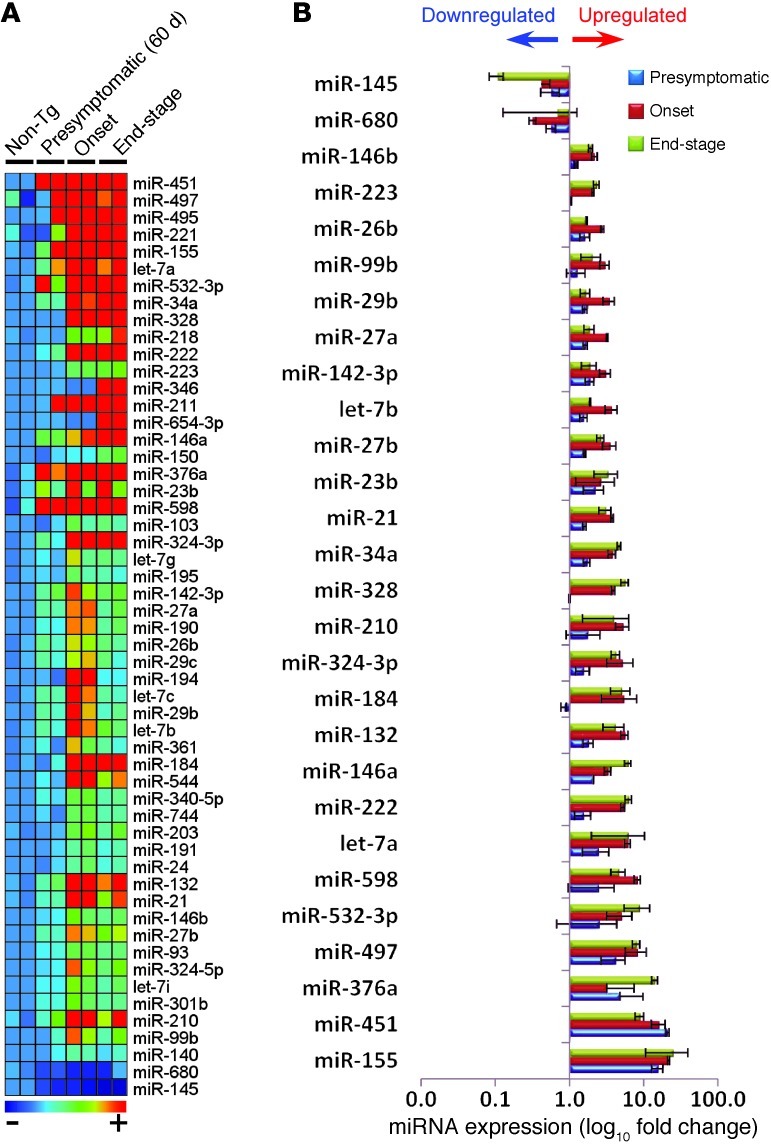
Figure 6. Changes in miRNA profiles of spinal cord–derived CD39+ microglia during the course of disease.
(A) miRNA profiling of spinal cord–derived CD39+ microglia in SOD1 mice compared with non-Tg mice from the same mice as described in Figure 4. (B) Summary of significantly affected miRNAs in spinal cord microglia in SOD1 mice compared with non-Tg mice validated in Singleplex qRT-PCR. Validated miRNAs were selected based on their differential expression at all disease stages. Data represent mean ± SD. All shown miRNAs were significantly affected (P < 0.05). miRNA expression level was normalized using ΔCt against U6 miRNA.

