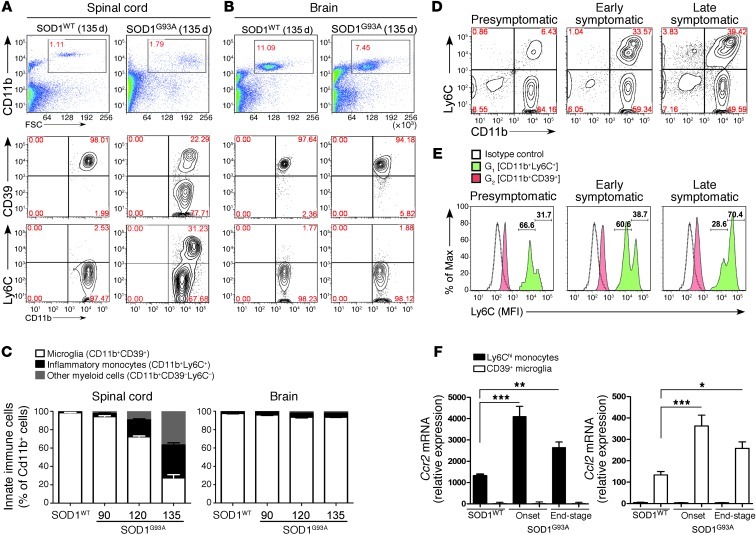
Figure 8. Ly6Chi monocytes are recruited to the spinal cord with disease progression in SOD1 mice.
(A) FACS analysis of isolated spinal cord and (B) brain-derived mononuclear cells for CD11b, CD39, and Ly6C at 135 days in SOD1 mice. Numbers represent the percentage of CD11b-gated cells in each quadrant. (C) Proportional increase in inflammatory monocytes (black) and myeloid cells (gray) and decrease in CD39+ resident microglia (white) as related to total CD11b+ cells. Data represent mean ± SEM from 3 experiments (pool of 4–5 mice per group). (D) Expansion of Ly6C monocytes from Ly6Clo to Ly6Chi during disease progression in the spinal cord. Numbers represent the percentage of cells in each quadrant. (E) Ly6C expression is increased during disease progression on recruited monocytes but not on resident microglia. The numbers show percentage of Ly6Clo (left) and Ly6Chi (right) monocytes. Open profiles represent staining pattern with an IC antibody; solid red profiles indicate CD11b+CD39+ microglia; and green profiles show recruited CD11b+Ly6C+ monocytes. Each panel represents a pool of 5 mice. Results are representative of 3 independent experiments. (F) qRT-PCR analysis of Ccr2 and Ccl2 mRNA expression in FACS-sorted CD39+ microglia and Ly6Chi monocytes from spinal cords of SOD1WT and SOD1G93A mice. Total RNA was isolated and pooled from 5 mice for each cell population. Expression levels were normalized to Gapdh. Data represent mean ± SEM. *P < 0.05, **P < 0.01, ***P < 0.001, 1-way ANOVA followed by Dunnett’s multiple-comparison post hoc test. Results are representative of 2 independent experiments.

