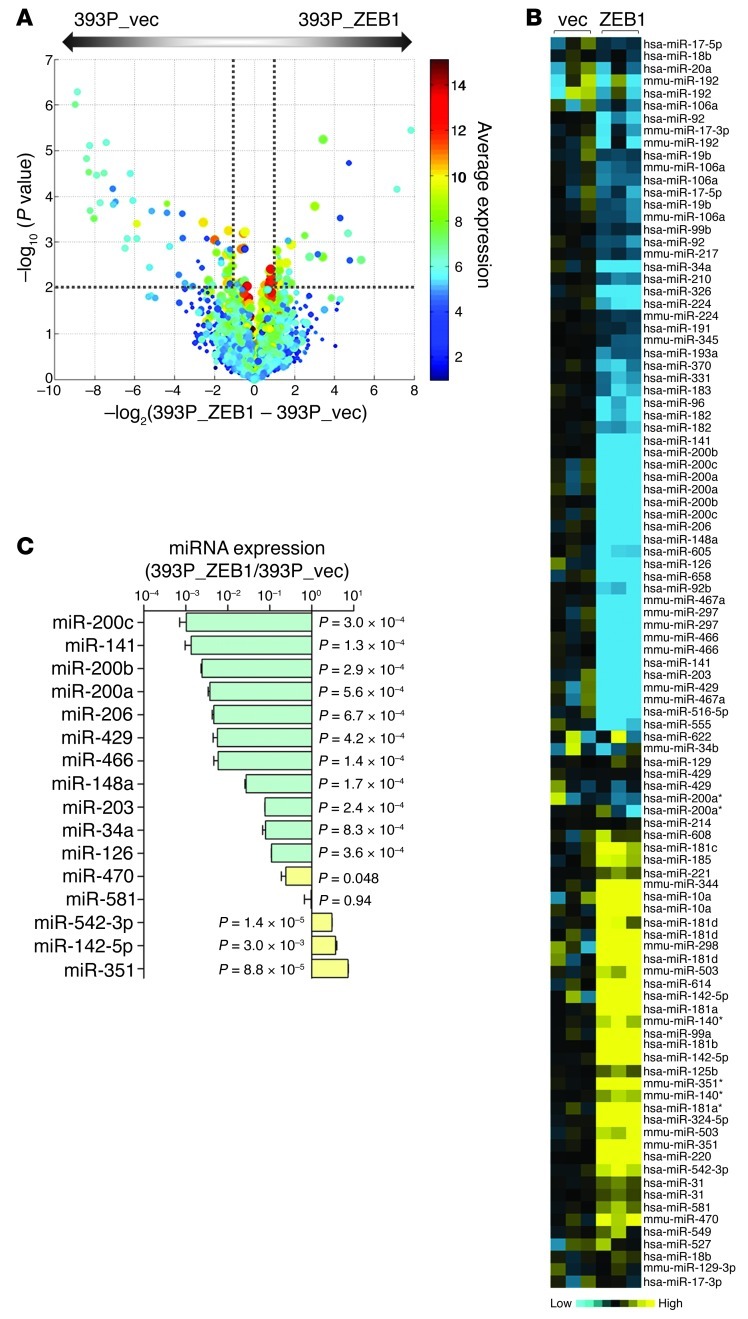
Figure 1. ZEB1 regulates the expression of numerous miRs.
(A) Volcano plot depiction of findings from microarray analysis showing the miRs differentially expressed in 393P_vector and 393P_ZEB1 cells. The –log10 of P values (y axis) is plotted against the log2 of fold change between 2 groups (x axis). The size of the circle for each probe is proportional to the miR detection rate for the entire experiment. Each symbol is color coded according to average expression of the probe across the 2 groups (scale at right). Dotted lines delineate the cutoffs for miRs significantly downregulated (left) or upregulated (right) in 393P_ZEB1 cells. (B) Heat map depiction of miRs differentially expressed in 393P_ZEB1 cells (ZEB1), using 393P_vector cells (vec) as reference. (C) Taqman microRNA assays (Q-PCR) to confirm miRs differentially expressed by microarray. Data are mean ± SD (n = 3 samples). P values are indicated (2-tailed Student’s t test).

