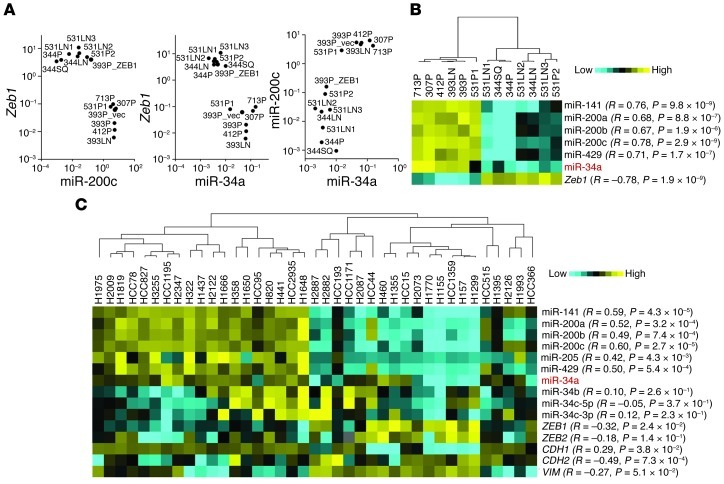
Figure 2. miR-34a levels correlate tightly with the ZEB1/miR-200 axis.
(A and B) Expression analysis of a panel of KP cell lines. (A) Log-scale cluster plots of normalized miR-200c and Zeb1 mRNA levels in 13 KP cell lines. Data are mean ± SD (n = 3 samples). 393P_ZEB1 and 393P_vector cells are included as controls. (B) Heat map representation of gene expression in A. (C) Expression analysis of a panel of human lung cancer cell lines. EMT marker expression in these 39 human cell lines was reported previously (17). Correlation (R and P, 1-tailed Spearman’s rank correlation test) is indicated for each gene relative to miR-34a.

