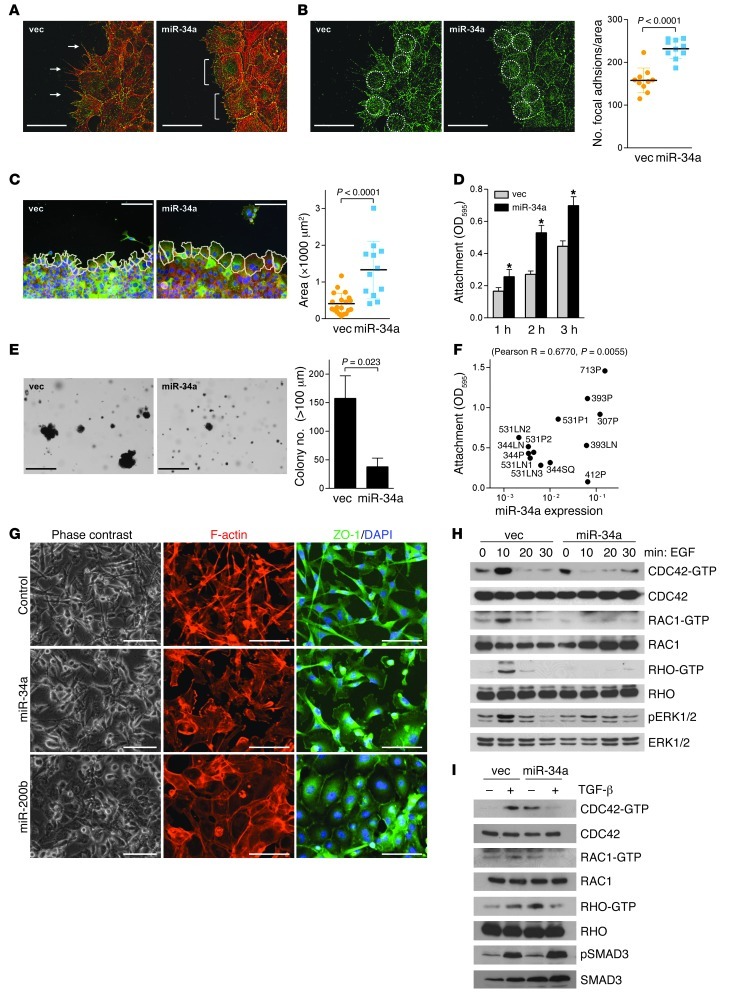
Figure 6. miR-34a regulates actin cytoskeletal remodeling and RHO family GTPase activity.
(A–C) Cells imaged at leading edge of scratch-wounded confluent cultures. (A) Filopodia (arrows) formed in 344SQ_vector, but not 344SQ_miR-34a, cells. Brackets denote lamellipodia. (B) Focal adhesions in anti-vinculin–stained cultures, counted per defined surface area of confluent cells (circles) using ImageJ. Data are mean ± SD (n = 10). Red, phalloidin; green, vinculin. (C) Cells were outlined (white lines), and their surface areas were measured using ImageJ. Data are mean ± SD (n = 20 [344SQ_vector]; 12 [344SQ_miR-34a]). (D) Attached cells were quantified 1, 2, or 3 hours after seeding by optical densitometry (595 nm) of cells stained with crystal violet. Data are mean ± SD (n = 3). *P < 0.01. (E) Cells seeded in soft agar were stained with nitrotetrazolium blue 3 weeks after seeding, and colonies larger than 100 μm in diameter were counted. Data are mean ± SD (n = 3). (F) Attached cells were quantified by optical densitometry 3 hours after seeding and expressed relative to miR-34a levels from Figure 2A. Correlation (R and P, 1-tailed Pearson’s correlation test) is indicated. (G) MDA-MB-231 cells transiently transfected with control, miR-34a, or miR-200b precursors and imaged under fluorescence (blue, DAPI; red, phalloidin; green, anti–ZO-1). As a comparison, miR-200b–transfected cells demonstrated mesenchymal-to-epithelial transition. (H and I) Western blot analysis of GTP-bound (CDC42-GTP) and total (CDC42) RHO family GTPases. Phospho-ERK1/2 (H) and phospho-SMAD3 (I) were included as positive controls for EGF- and TGF-β–induced signaling, respectively. Scale bars: 50 μm (A, B, and G); 100 μm (C); 500 μm (E). See complete unedited blots in the supplemental material.

